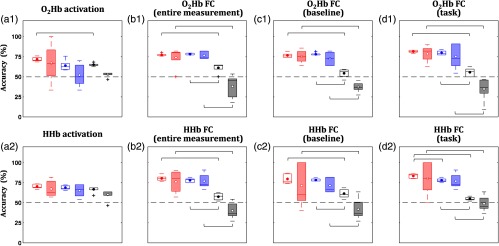
Fig. 6.
Comparisons of training (void boxplots) and test (patched boxplots) accuracies during cross-validation (i.e., fivefold) in the case of three ways of selecting features: best performing single feature (red boxplots), significant between-group features (blue boxplots), and all available features (black boxplots). Comparisons were assessed for (a) activation connectivity features in the (b) entire measurement, (c) baseline, and (d) task intervals for (a1)–(d1) and (a2)–(d2) HHb. Brackets indicate significant differences between two methods (two-sample -test; ; ).

