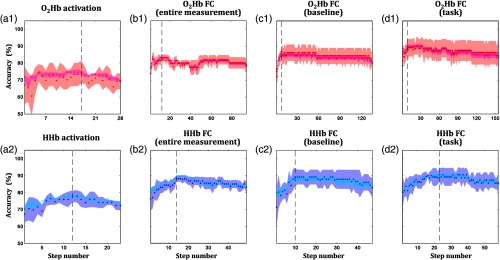
Fig. 7.
Stepwise optimization of classification analysis to obtain the highest training (magenta and cyan for and HHb, respectively) and test (red and blue for and HHb, respectively) accuracies in (a) activation, connectivity features in the (b) entire measurement, (c) baseline, and (d) task intervals for (a1)–(d1) and (a2)–(d2) HHb. Scattered points represent the averaged accuracies across cross-validated subsets; neighboring patches are associated with the standard error of accuracies. Dashed lines indicate the highest summation of cross-validated and averaged training and test accuracies.

