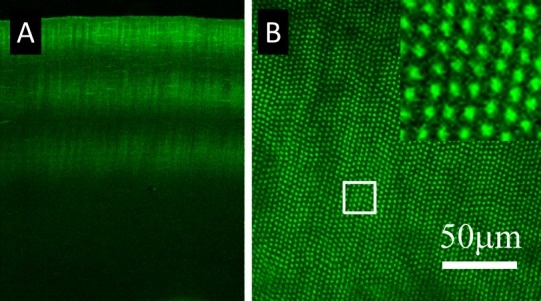
Figure 1.

CAF of single spot amplified NLO CXL. The image shown in (A) demonstrates the CAF within a vibratome section of a cornea treated with three separate layers of single spot amplified NLO CXL. (B) The en face view of a cornea treated in the same way. A grid of CAF spots can clearly be seen within the sample, and each spot represents CXL from a single amplified pulse.
