Figure 7.

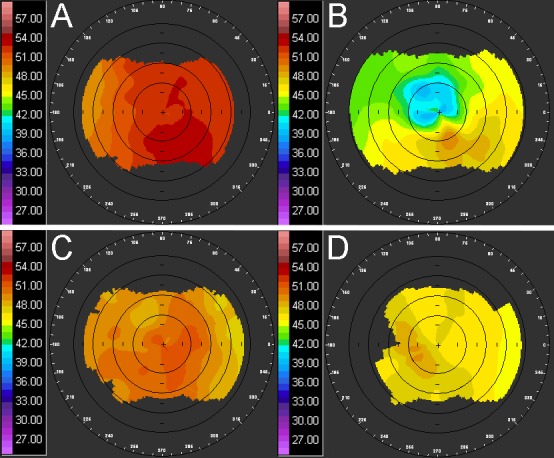
In vivo corneal topography. Example images of corneal topography measurements at baseline (A and C) and 2 months after treatment (B and D) of the treated right eye (A and B) and the control left eye (C and D).

In vivo corneal topography. Example images of corneal topography measurements at baseline (A and C) and 2 months after treatment (B and D) of the treated right eye (A and B) and the control left eye (C and D).