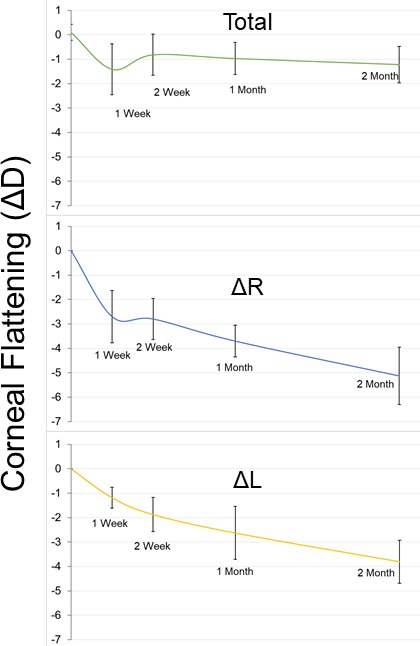
Figure 8.

Amplified NLO CXL induced corneal flattening. Graph of corneal flattening measured as change in diopter of right versus left eye (Total), right eye versus baseline (ΔR), and left eye versus baseline (ΔL) over all time points. Corneal flattening decreased dramatically after 1 week of healing, then reverted slightly and began to flatten more steadily. Error bars represent standard deviation.
