
Figure 2.
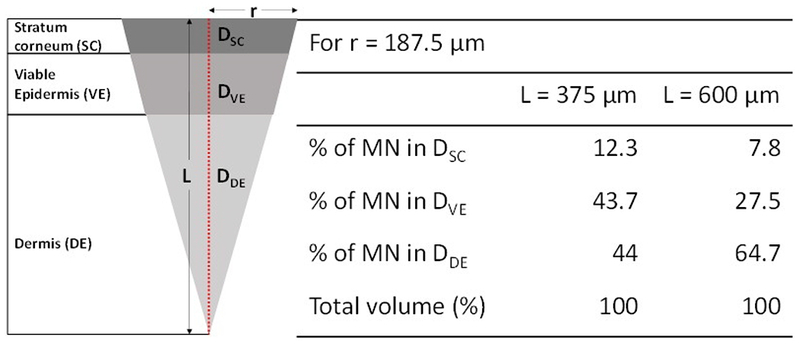
Representative drug deposition subsequent to microneedle insertion in different layers of the skin at time t = 0 h for varying insertion depths. L - microneedle insertion depth, r – radius of the created pore; DSC, DVE, DDE – amount of drug present in stratum corneum, viable epidermis and dermis respectively.