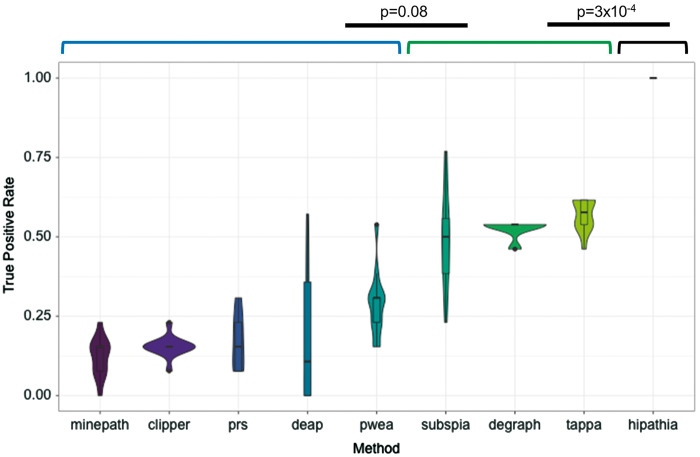
Figure 2.
TPR or sensitivity was computed as the number of significant cancer pathways found, when cancer samples are compared with samples of the tissue of reference, divided by the total number of cancer pathways (14 for HiPathia and DEAP and 13 for the rest of methods, because PPAR signaling pathway [hsa03320] was not implemented in them) per method and cancer. Violin plots obtained using 12 cancer types show for any method the mean TPR in the central dot, all possible results, with thickness indicating how common, in the outer shape and the layer inside, represents the values that occur 95% of the time. The figure shows the methods ranked by TPR value. A Wilcoxon test with Bonferroni correction was used to compare successive TPR distributions to detect significant differences among them. Black lines denote significant differences between consecutive methods. Brackets define groups of methods with no significant differences in their performances.

