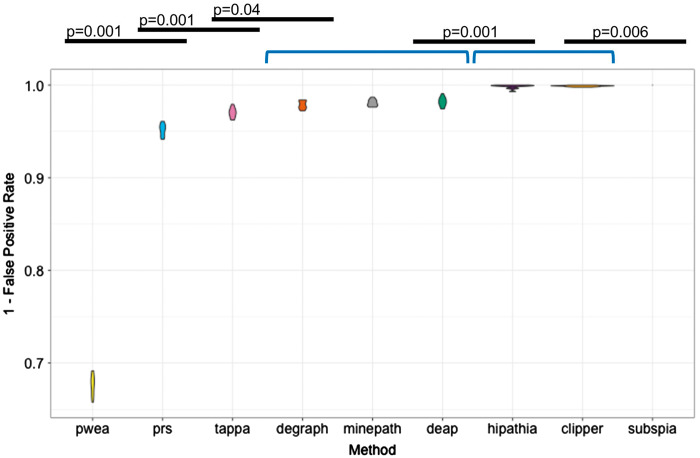
Figure 3.
FPR or specificity was computed as the mean of the number of significant cancer pathways found, when cancer samples are compared with cancer samples, divided by the total number of KEGG cancer pathways along 100 bootstraps, per method and cancer. Violin plots show average values and distributions of the proportions of false discoveries made by any method. The figure shows the methods ranked by FPR value. A Wilcoxon test with Bonferroni correction was used to compare successive FPR distributions to detect significant differences among them. Black lines denote significant differences between consecutive methods. Brackets define groups of methods with no significant differences in their performances.

