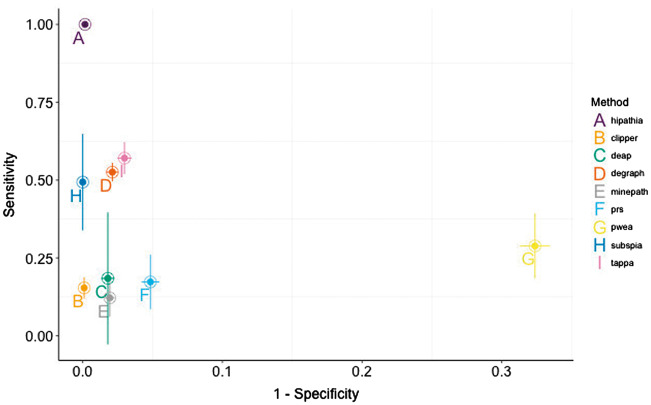
Figure 5.
Simultaneous comparison of sensitivities and specificities of the different MPA methods. The results obtained in the 12 cancers are used to obtain a mean value and an error. The x-axis represents 1 − the FPR. Horizontal bars represent in each point 1 SD of the FPR for the corresponding method.

