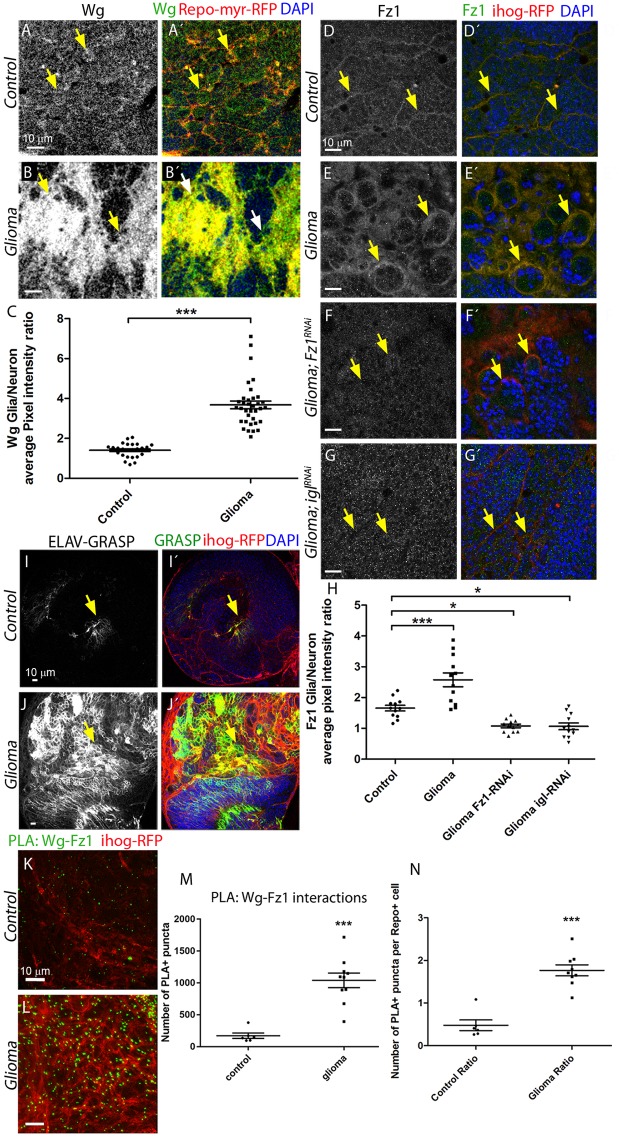
Fig 2. Wg/Fz1 accumulate in glioma cells, and Fz1 in glia interacts with neuronal Wg.
Larval brain sections with glial cell bodies and membranes labeled in red (myrRFP) and stained with Wg antibody show homogeneous expression in the control brains (A) in gray (green in the merge). In the glioma brains, Wg accumulates in the glial transformed cells (B); the Wg average pixel intensity ratio between Glia/Neuron quantification is shown in panel C. Arrows indicate Wg staining in glial membranes. (D–G) Glial cells are labeled with UAS-Ihog-RFP to visualize the glial network (red) and stained with Fz1 (gray or green in the merge). (D) Fz1 is homogeneously distributed in control brains, with a slight accumulation in the Ihog+ structures. (E) Fz1 accumulates in the TMs and specifically in the projections that are in contact with the neuronal clusters. (F) Upon knockdown of fz1 in glioma brains, the tumoral glial network is still formed but Fz1 is not detectable. (G) Knockdown of igl in glioma brains restores a normal glial network, and Fz1 shows a homogeneous distribution along the brain section. Arrows indicate Fz1 staining in glial membranes. (H) Fz1 average pixel intensity ratio between Glia/Neuron quantification. Arrows indicate Fz1 staining in glial membranes. (I–J) GRASP technique was used, and both halves of GFP tagged with a CD4 signal to direct it to the membranes (CD4-spGFP) were expressed in neurons (elav-lexA) and glial (repo-Gal4) cells, respectively. Only upon intimate contact is GFP protein reconstituted and green fluorescent signal is visible. (I) Control brains showed a discrete GFP (green) signal corresponding to the physiological interaction between glia and neurons. (J) In glioma brains, a strong GFP signal from the GRASP reporter is detected. Arrows indicate GRASP reconstitution GFP signal. (K–L) PLAs were performed in control and glioma brains to quantify the interactions between Wg and Fz1. (K) Control brains showed a discrete number of PLA+ puncta (green) showing the physiological interactions. (L) Glioma brains showed a 5-fold increase in the number of puncta, quantified in panel M. The number of PLA+ Wg-Fz1 interactions per Repo+ cell in control and glioma brains is shown in panel N. Arrows indicate PLA+ puncta. Nuclei are marked with DAPI (blue). Error bars show SD; *P < 0.01; ***P < 0.0001. The data underlying this figure can be found in S1 Data. Genotypes: (A) w; Gal80ts; repo-Gal4, UAS-myrRFP/UAS-lacZ, (B) UAS-dEGFRλ, UAS-dp110CAAX; Gal80ts; repo-Gal4, UAS-myrRFP, (C) w;; repo-Gal4, ihog-RFP/UAS-lacZ, (D) UAS-dEGFRλ, UAS-dp110CAAX;; repo-Gal4, UAS-ihog-RFP, (E) UAS-dEGFRλ, UAS-dp110CAAX; UAS-Fz1-RNAi; repo-Gal4, UAS-ihog-RFP, (F) UAS-dEGFRλ, UAS-dp110CAAX;; repo-Gal4, UAS-ihog-RFP /UAS-igl-RNAi, (I) w;; elav-lexA; repo-Gal4, UAS-ihog-RFP/UAS-CD4-spGFP1-10, lexAop-CD4-spGFP11, (J) UAS-dEGFRλ, UAS-dp110CAAX; elav-lexA; repo-Gal4, UAS-ihog-RFP/ UAS-CD4-spGFP1-10, lexAop-CD4-spGFP11, (K) w;; repo-Gal4, ihog-RFP/UAS-lacZ, (L) UAS-dEGFRλ, UAS-dp110CAAX;; repo-Gal4, UAS-ihog-RFP. elav, embryonic lethal abnormal vision; Fz1, Frizzled1; GFP, green fluorescent protein; GRASP, GFP Reconstitution Across Synaptic Partners; igl, igloo; myrRFP, myristoilated Red Fluorescent Protein; PLA, proximity ligation assay; TM, tumor microtube; Wg, wingless.

