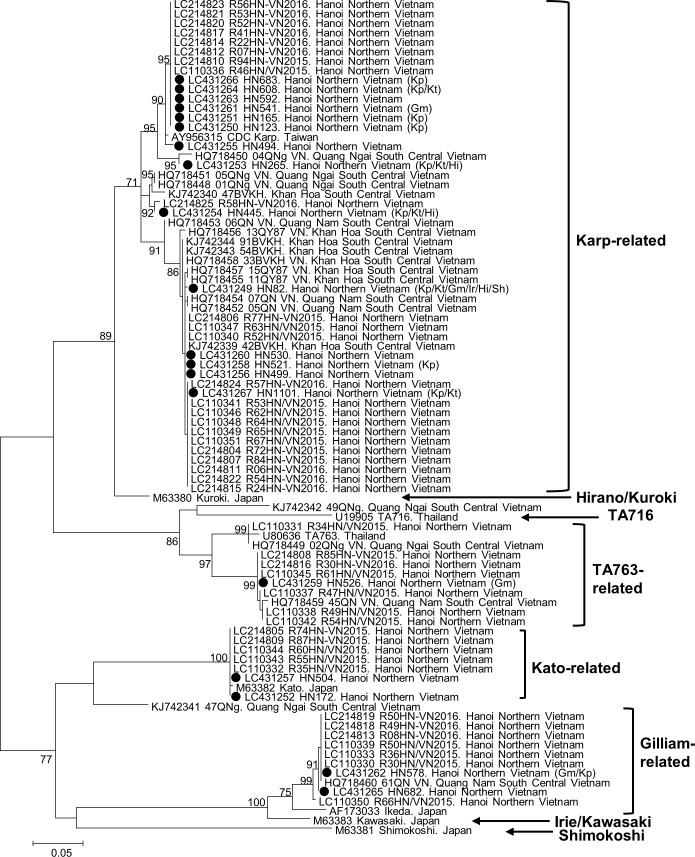
Fig 2. Phylogenetic tree of O. tsutsugamushi 56-kDa tsa gene sequences of the strains reported in Vietnam.
GenBank accession number, strain name, and reported place are indicated. The evolutionary history was inferred by using the maximum likelihood method based on the Tamura-Nei model with a discrete gamma distribution with a bootstrap test of 1000 replicates. Bootstrap values higher than 70 were considered to be statistically significant and are shown next to the branches. The tree is drawn to scale, with branch lengths measured using the number of substitutions per site. All positions with less than 95% site coverage were eliminated. That is, fewer than 5% of alignment gaps, missing data, and ambiguous bases were allowed at any position. There were a total of 393 positions in the final dataset. Evolutionary analyses were conducted with MEGA6. Types of antigen with the highest reaction by immunoperoxidase assay are indicated with a bracket, if the patient was tested. Kp: Karp, Kt: Kato, Gm: Gilliam, Hi: Hirano/Kuroki, black circle: strains in the present study (GenBank accession numbers: LC431249-LC431267).

