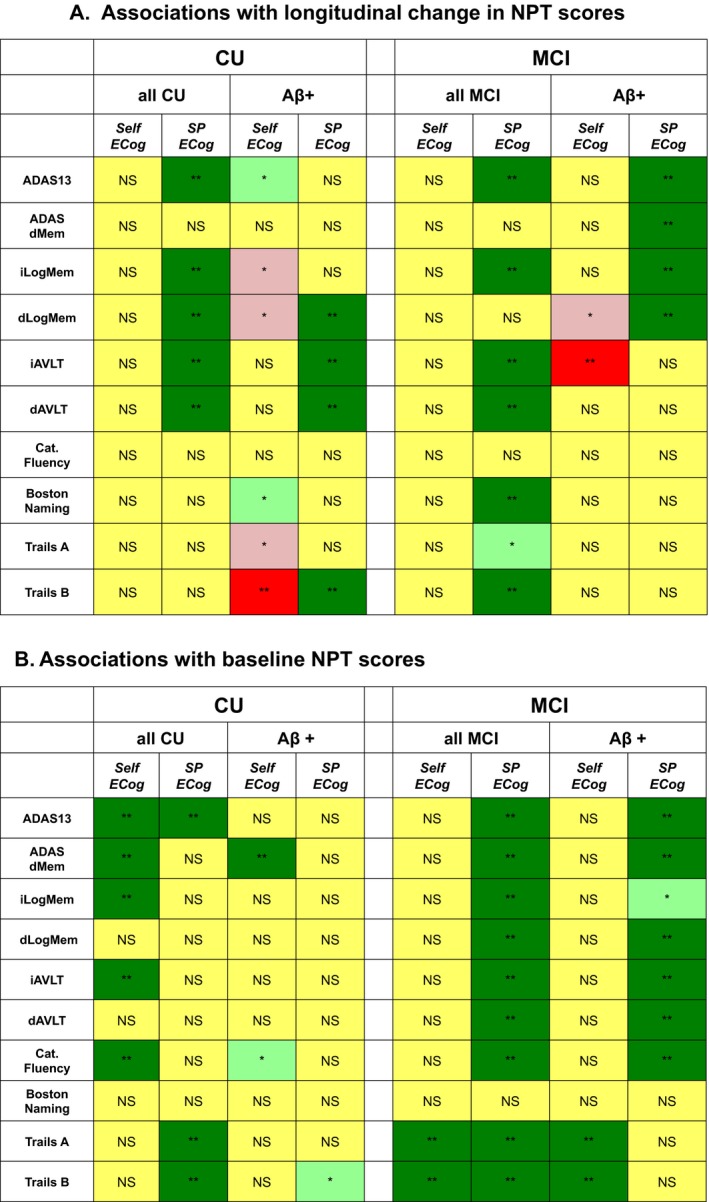
Figure 1.

Associations between Neuropsychological test scores and ECog. Associations with longitudinal change in NPT scores (A) or baseline NPT scores (B) are color‐coded according to statistical significance in linear mixed effects models. Dark green (**): Higher (worse) ECog score associated with worse NPT score, P < 0.001, significant after multiple comparison correction. Light green (*): Higher (worse) ECog score associated with worse NPT score, P < 0.05, not significant after multiple comparison correction. Yellow (NS): No significant association between NPT score and ECog, P> 0.05. Pink (*): Higher (worse) ECog score associated with better NPT score, not significant after multiple comparison correction. Red (**): Higher (worse) ECog score associated with better NPT score, P < 0.001, significant after multiple comparison correction
