Figure 1.

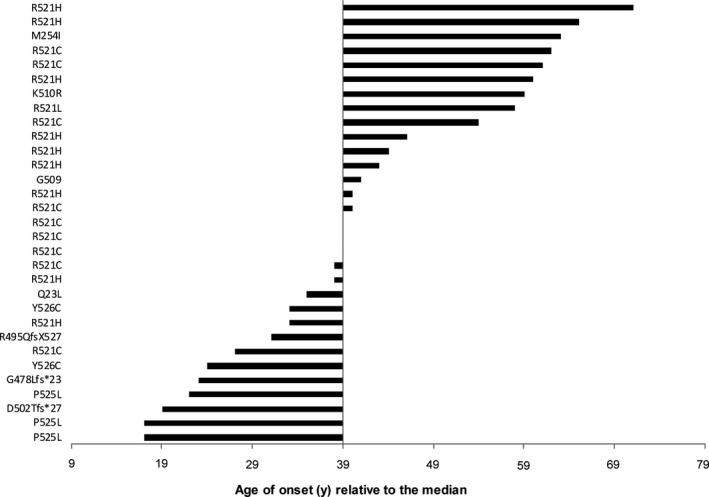
Age at onset of newly acquired patients (=cohort 1) depicted as bar diagram for every case starting from the median value, n = 30. Similarly, data of all patients (cohort 1 and 2) are shown in Figure S1.

Age at onset of newly acquired patients (=cohort 1) depicted as bar diagram for every case starting from the median value, n = 30. Similarly, data of all patients (cohort 1 and 2) are shown in Figure S1.