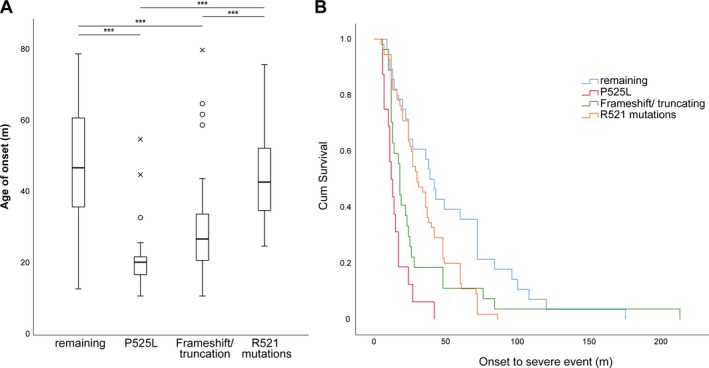
Figure 3.

(A) Box plots showing the median age of onset for selected patient groups with the highest frequencies in the cohort. Statistical testing was performed using a Kruskal‐Wallis test followed by Bonferroni correction, ***P < 0.001. (B) Kaplan‐Meier survival curve measuring the OTSE. The groups were found to have significantly different cum. survival rates as demonstrated by the Log‐rank test, P < 0.001.
