Figure 6.

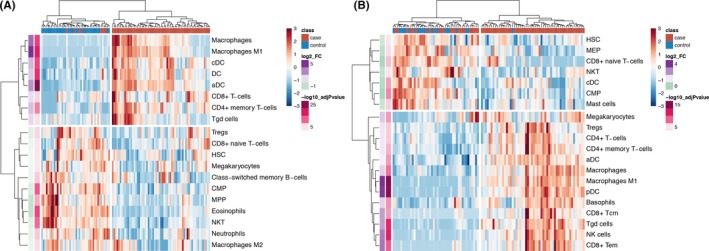
Heatmaps of cell‐type enrichment calculated using xCell demonstrates clustering of cases and controls based on cell types in both muscle (A) and skin (B). Enrichment was strongest for dendritic cells and M1 macrophages in both tissues.

Heatmaps of cell‐type enrichment calculated using xCell demonstrates clustering of cases and controls based on cell types in both muscle (A) and skin (B). Enrichment was strongest for dendritic cells and M1 macrophages in both tissues.