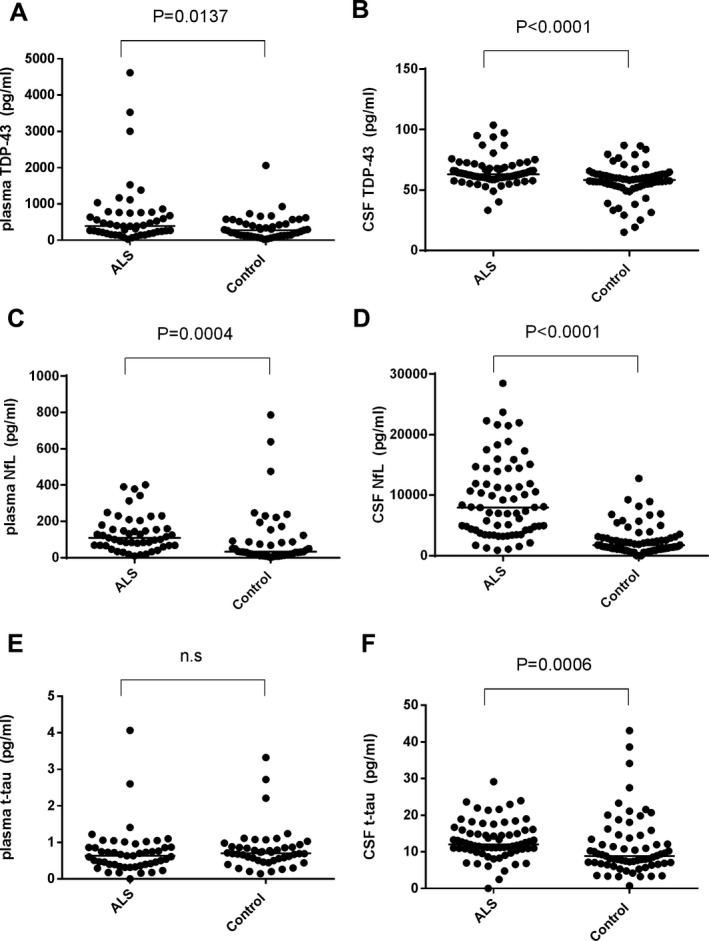
Figure 6.

Scatter plots of biomarker levels in combined analysis of the discovery and validation cohorts. Analyses of plasma biomarkers involved 49 ALS patients and 47 controls; CSF biomarker analyses involved 71 ALS patients and 68 controls. Levels of plasma and CSF TDP‐43 (A, B), NfL (C, D), t‐tau (E, F) are presented. Because of interassay variation, we corrected the values of the validation cohort based on the correction formula: raw values × correction coefficient: 2.01 for plasma TDP‐43, 1.67 for CSF TDP‐43, 3.26 for plasma NfL, 0.98 for CSF NfL, 1.58 for plasma t‐tau, and 0.27 for CSF t‐tau. The correction factors were determined as the mean value ratios between the discovery and validation assays based on four internal controls for each biomarker. Bars indicate median values. The P‐value generated by Mann–Whitney’s U test between the ALS and whole control groups is presented above each graph. n.s: not significant. Note: The correction coefficients were higher than those expected from interassay concordance reported by the supplier. This may be attributable to lot‐to‐lot differences of the kits (see Table S3).
