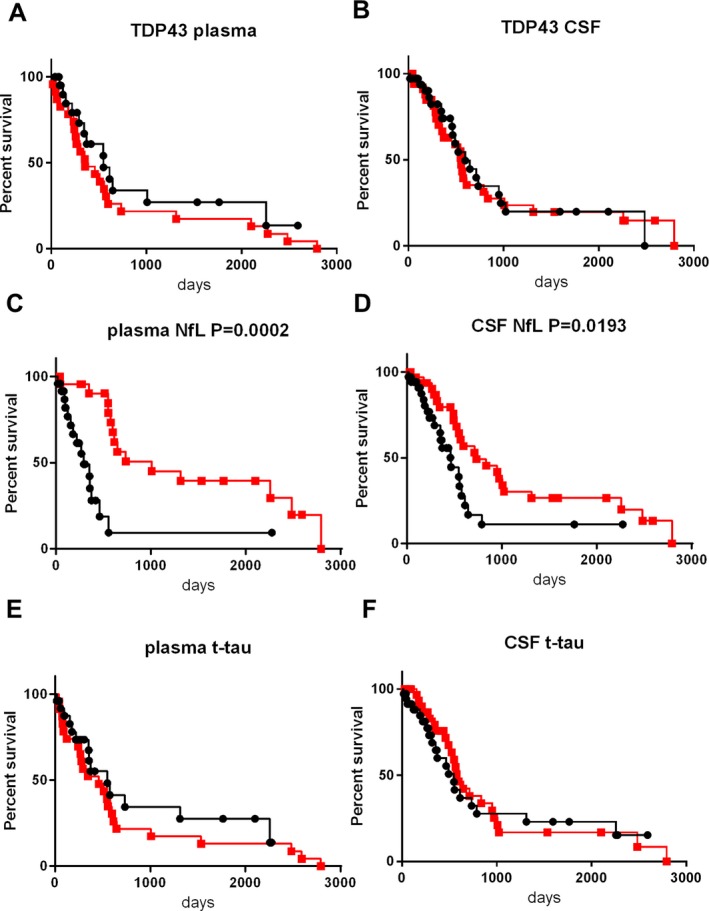
Figure 7.

Kaplan–Meier survival curves in ALS patients on combined analysis of the discovery and validation cohorts. Correction of interassay variation was conducted using the formula presented in Figure 6. (A): plasma TDP‐43, (B): CSF TDP‐43, (C): plasma NfL, (D): CSF NfL, (E): plasma t‐tau, (F): CSF t‐tau. Patients were subdivided into two groups according to the cut‐off biomarker levels. The cut‐off value in each graph was set as the median value of the corresponding biomarker within the ALS group. The squares and circles indicate an event (death, tracheostomy, or invasive ventilation). The black lines with black circles represent patients with levels of biomarkers no lower than the cut‐off (the high–level group). The red lines with red squares represent those with levels lower than the cut‐off (the low–level group).
