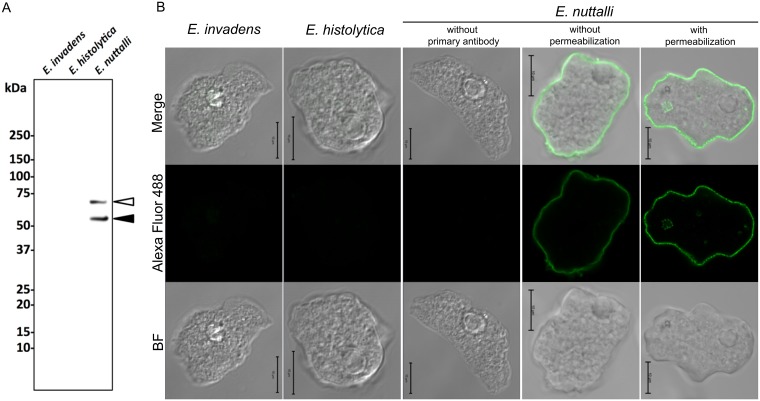
Fig 5. PTORS expression in Entamoeba species.
(A) Confirmation of expression of PTORS by immunoblot analysis with antisera specific for PTORS. Lanes contain 30 μg protein of whole cell lysates from E. nuttalli, E. histolytica HM-1:IMSS, and E. invadens IP-1. Closed and open arrowheads indicate PTORS bands without and with putative post-translational modification, respectively. (B) Immunofluorescence images of E. nuttalli, E. histolytica, and E. invadens using antisera specific for PTORS. Scale bar = 10 μm. Entamoeba species were stained by treatment with/without Triton X-100 and with/without antisera specific for PTORS. Merged bright field (BF) and fluorescence images are also shown (Merge). These images are approximately 0.9 μm in thickness per section.

