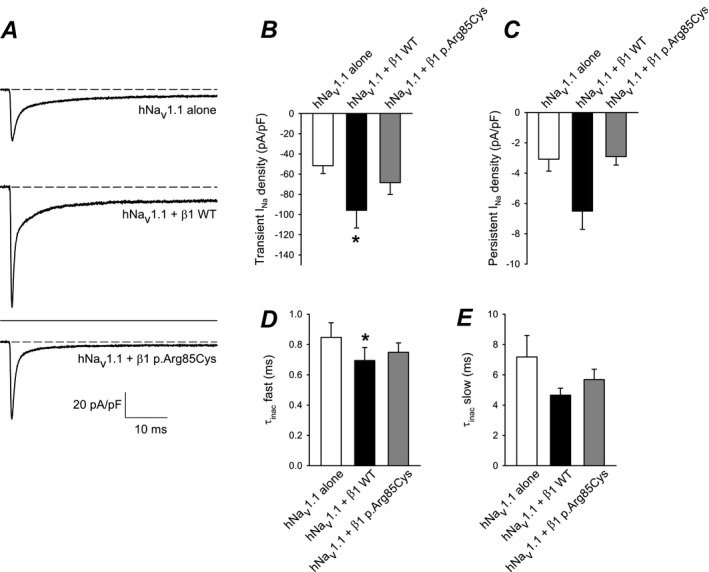
Figure 8.

β1‐p.Arg85Cys does not modulate INa density or τ of inactivation. (A) Representative INa density traces; currents were evoked with a 50‐msec test pulse to 0 mv following a prepulse to − 120 mV. Top: Cells expressing hNav1.1 alone (eGFP only). Middle: Cells expressing hNav1.1 plus WT β1 subunits. Lower: Cells expressing hNav1.1 plus β1‐p.Arg85Cys subunits. All traces are shown at the same scale. (B) Mean transient INa density measured at the peak from currents represented in (A). (C) Mean persistent INa density measured as the average current of the last 2 msec of the current to 0 mV represented in (A). (D and E) INa inactivation was fit to a double exponential equation and the mean τ for the fast and slow components were plotted. n = 13 cells per condition; *P < 0.05. Error bars indicate mean ± standard error of the mean. *P < 0.05. [Correction added on 06 December 2019 after first online publication: Figure 8 has been updated.]
