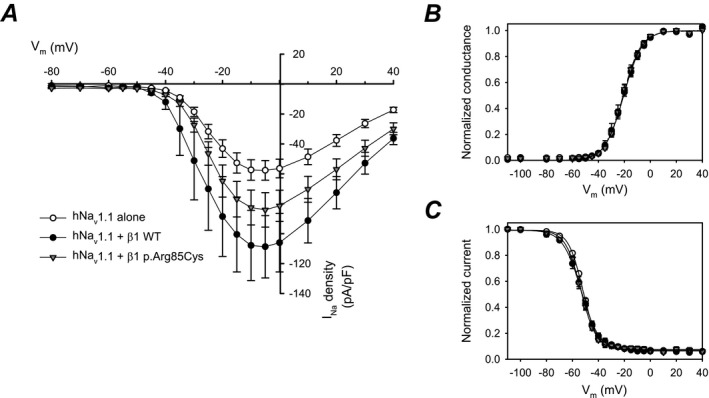
Figure 9.

WT β1 subunit co‐expression increases hNav1.1 INa density but neither WT β1 nor β1‐p.Arg85Cys affect the voltage dependence of hNav1.1‐generated INa. (A) Mean current‐voltage relationships of transient INa: hNav1.1 alone, tranfected with eGFP only, (open circles, n = 12 cells), hNav1.1 plus WT β1 (closed circles, n = 11 cells), hNav1.1 plus β1‐p.Arg85Cys (triangles, n = 13 cells). (B) Activation curves from the data shown in (A). (C). Steady‐state inactivation curves recorded using a standard two‐pulse protocol (hNav1.1, n = 12 cells; hNav1.1 plus WT β1, n = 13 cells; hNav1.1 plus β1‐p.Arg85Cys, n = 13 cells). [Correction added on 06 December 2019 after first online publication: Figure 9 has been updated.]
