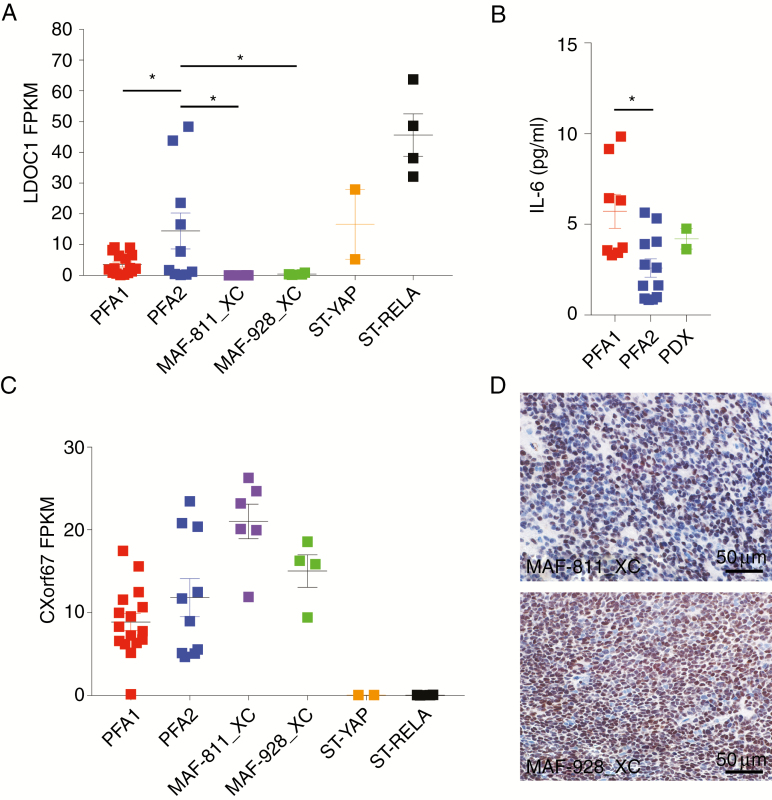
Fig. 4.
Molecular characterization of 1q+ PFA1 PDX. (A) LDOC1 transcript from RNAseq profiles. Values are in fragments per kilobase of transcript per million mapped reads (FPKM). (B) Human IL-6 concentrations (pg/mL) in CSF. (C) CXorf67 transcript from RNAseq analysis. Values are in FPKM. *P < 0.05. Error bars present standard error of the mean. (D) Immunohistochemical staining of CXorf67 protein in PDX lines. Brown denotes cells stained positive for CXorf67; slides were counterstained with hematoxylin. Scale bars indicated on images.

