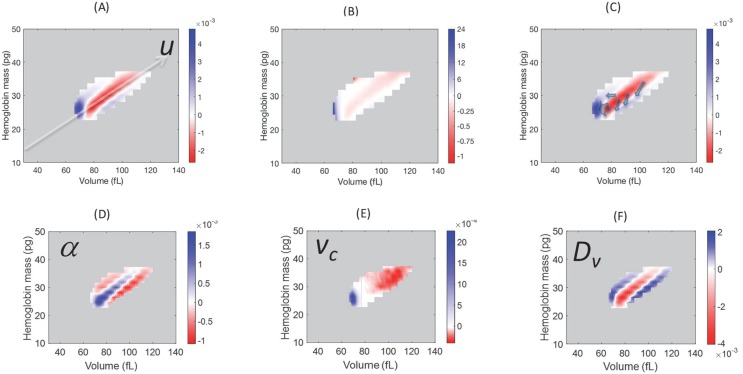
Figure 3. Model simulations show that blood loss causes a shift of probability density from the central axis of the (v,h) distribution, mostly to the low volume-low hemoglobin tail.
Comparison of the absolute (A) and relative (B) changes in the simulated single-RBC volume-hemoglobin probability density when setting Dv’=4Dv, α’=2α, and vc’=0.9vc, to match the median changes shown in Figure 2B. (C) Arrows depict the typical movement in probability density 1–3 days after blood loss. (D–F) show the effects of isolated changes to individual parameters, with changes to α and vc corresponding to retention of older RBCs (delayed clearance), and changes to Dv adding density in the high-volume, low-hemoglobin region where new RBCs appear, corresponding, in part, to increased production.

