. 2019 Dec 11;8:e50706. doi: 10.7554/eLife.50706

Figure 3. T5 neurons generate directional selectivity using ND suppression.

(A) Schematized responses to the elementary motion stimulus of sequential bar pair flashes. Response could be the sum of the responses to the individual flashes (top), could show preferred direction, PD, enhancement (middle) or null direction, ND, suppression (bottom). (B) Baseline-subtracted responses (mean ± SEM) to bar pair combinations presented at different positions along the PD–ND axis (n = 3,11,11,8 cells). Top: responses to PD and ND bar pairs. Middle: responses to PD bar pairs (same as top) with the temporally aligned sum of the responses to the component bar flashes in pink. Bottom: responses to ND bar pairs (same as top), sum of responses to component bar flashes in cyan. Stimulus presentation interval indicated with gray rectangles. Stimulus schematic shows positions of both bars (0 position depicted by elongated bar). (C) Boxplot summary of response maxima for (B) (same color conventions). Top: response maxima, Middle and Bottom: second bar maxima for measured and summed responses. (D) Boxplot summary of response maxima differences for all (non-overlapping) bar pair stimuli presented. Top: difference between PD and ND, positive value indicates a directionally selective response. Middle: difference between second bar response maxima for measured and summed PD responses. Positive value indicates PD enhancement. Bottom: same as middle, but for ND. Negative value indicates ND suppression (* indicates mean significantly differs from zero, unpaired t-test corrected for multiple comparisons by controlling for the false discovery rate with q = 0.075). Boldface positions are presented in (B) and (C). (E) Comparison of directional selectivity versus linearity of response for all presented bar pair combinations, including data from (D) and responses to overlapping positions (see Materials and methods). Each dot corresponds to the mean (of n ≥ 3 cells) response differences for each position pair (± SEM). Marker size indicates bar width (small for 2, large for 4-pixel wide), marker fill indicates duration (empty 40 ms, filled 160 ms). Results of linear regression in black (non-significant slope for MeasuredPD - SumPD vs. MaxPD - MaxND, [−0.402, 0.073], 95% confidence interval; significant slope for MeasuredND - SumND vs. MaxPD - MaxND, [−0.641,–0.301], 95% confidence interval). See also Figure 3—figure supplement 2 for more details of bar width four responses.

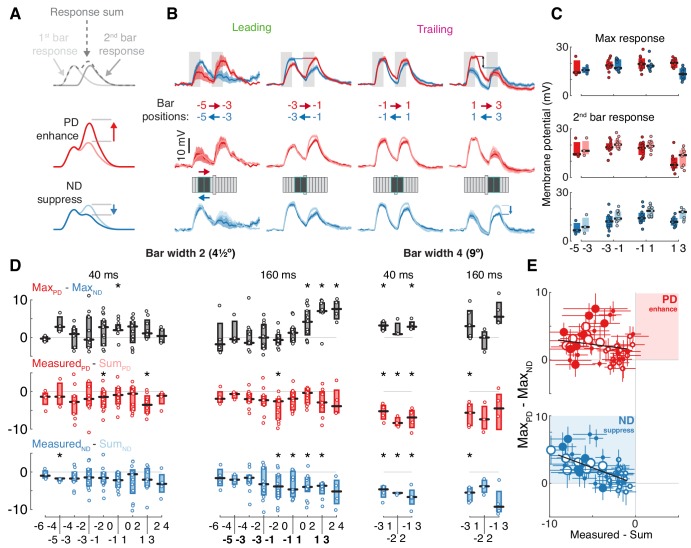
Figure 3.

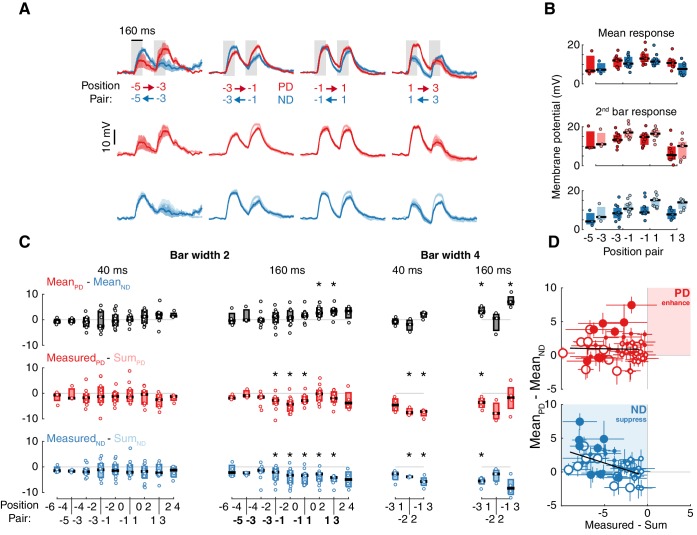
Figure 3—figure supplement 1. Evidence for ND suppression is robust to measurement type.

Figure 3—figure supplement 1.

This figure shows the same analysis and results as in Figure 3, but summarized using response mean rather than peak. (A) Baseline-subtracted responses (mean ± SEM) to bar pair combinations presented at different positions along the PD–ND axis (same as in Figure 3). (B) Boxplot summary of response means for (A) (same color conventions). Top: response means, Middle and Bottom: second bar means for measured and summed responses. (C) Boxplot summary of differences in response means for all (non-overlapping) bar pair stimuli presented. Top: difference between PD and ND, positive value indicates a directionally selective response. Middle: difference between second bar response means for measured and summed PD responses. Positive value indicates PD enhancement. Bottom: same as middle, but for ND. Negative value indicates ND suppression (* indicates mean significantly differs from zero, unpaired t-test corrected for multiple comparisons by controlling for the false discovery rate with q = 0.075). Boldface positions are presented in (A and B). (D) Comparison of directional selectivity versus linearity of response for all presented bar pair combinations, including data from (C) and responses to overlapping positions (see Materials and methods). Each dot corresponds to the mean (of n ≥ 3 cells) response differences for each position pair (± SEM). Marker size indicates bar width (small for 2, large for 4-pixel wide), marker fill indicates duration (empty 40 ms, filled 160 ms). Results of linear regression in black (non-significant slope for MeasuredPD - SumPD vs. MeanPD - MeanND , [−0.25, 0.21], 95% confidence interval; significant slope for MeasuredND - SumND vs. MeanPD - MeanND ,. [−0.6,–0.21], 95% confidence interval).
Figure 3—figure supplement 2. Apparent motion responses show evidence only for ND suppression even for larger stimuli.

Figure 3—figure supplement 2.

(A) Same as Figure 3B for 4-pixel-wide (9°) apparent motion stimuli. Stimulus schematic depicts positional information only and are presented in a staggered manner to illustrate overlapping positions for these pairwise combinations. Numbers below each column indicate the number of cells for that pairwise comparison. (B) Same as (A), but for non-overlapping positions. Summary of these pairwise combinations is shown in Figure 3D. Every combination shows a clear sub-linearity in response to the second bar’s appearance (measured response is always close to or smaller than the summed response in the lighter color).