. 2019 Dec 17;8:e49948. doi: 10.7554/eLife.49948

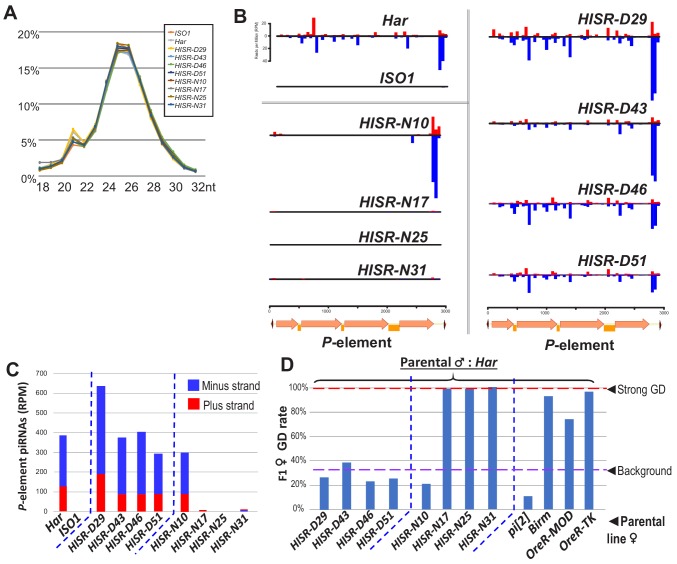
Figure 3. P-element directed piRNA production in HISR strains ovaries.

(A) Nearly identical size distributions of small RNAs from parental and HISR ovaries. (B) P-element piRNAs coverage plots and (C) quantitation of the P-element piRNAs mapping to plus and minus strands, in reads per million (RPM). (D) Assays for repression of P-element induced GD for HISR strains (N ≥ 100 females) are a good proxy for production of piRNAs silencing P-elements.

Figure 3—source data 1. Spreadsheets with the calculations for P-element piRNA coverage and tabulation of gonadal dysgenesis assays.

Figure 3.

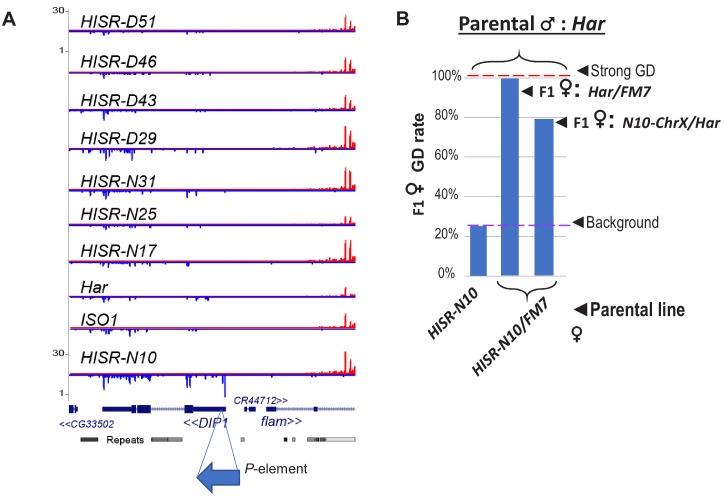
Figure 3—figure supplement 1. Candidate locus for P-element directed piRNA production in HISR-N10 ovaries.

Figure 3—figure supplement 1.

(A) Genome browser plots of small RNAs mapping to the DIP1 locus, adjacent to Flamenco piRNA locus, where only HISR-N10 has a novel P-element insertion at this region that is causing increased piRNAs at this locus. (B) A parental female of HISR-N10 with the FM7 balancer chromosome for X are then crossed with Har males to test for GD repression as in Figure 3C.
Figure 3—figure supplement 1—source data 1. Spreadsheet with the tabulation of gonadal dysgenesis assays.
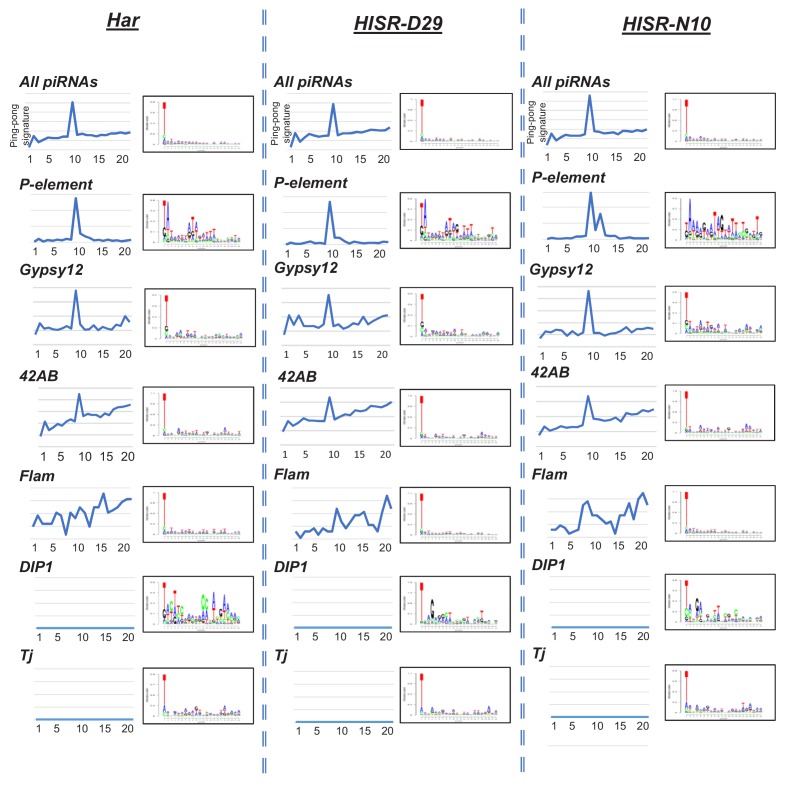
Figure 3—figure supplement 2. Analysis of piRNA ping-pong signatures on the P-element versus ovarian total small RNAs and specific transposons and somatic piRNA cluster loci.

Figure 3—figure supplement 2.

Register analysis can clearly detect a ping-pong signature peak at Position 10 for all piRNAs and the 42AB germline piRNA cluster, as well as ping-pong piRNA targeting of Gypsy12 and P-element. No ping-pong signature for somatic ovarian follicle cell piRNA clusters such as Flamenco, DIP1, and Tj. Sequence logos mainly show the bulk of nucleotide compositions of PIWI and A piRNAs bias for 5' U, while the 10A bias is masked by the low abundance of AGO3. Nevertheless, a small 10A and 9T is observable in P-element-directed piRNAs.
HHS Vulnerability Disclosure