. 2019 Dec 17;8:e49750. doi: 10.7554/eLife.49750

Figure 1. Haustorium-induced small RNAs (HI-sRNAs) are present in multiple Cuscuta species.

(A) Phylogeny of select Cuscuta species. Size distribution of HI-sRNAs for each sequenced isolate and acronyms are shown. (B) Sampling and sequencing schematic to discern HI-sRNAs. (C) HI-sRNA family counts and membership for each isolate, showing only the top 15 groups. Families were grouped strictly using a maximum edit distance of one nucleotide. Yellow indicates families present in a single isolate.

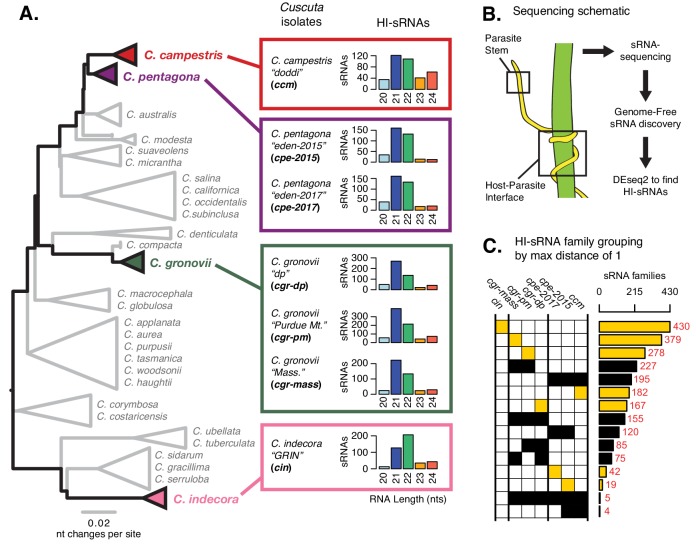
Figure 1.

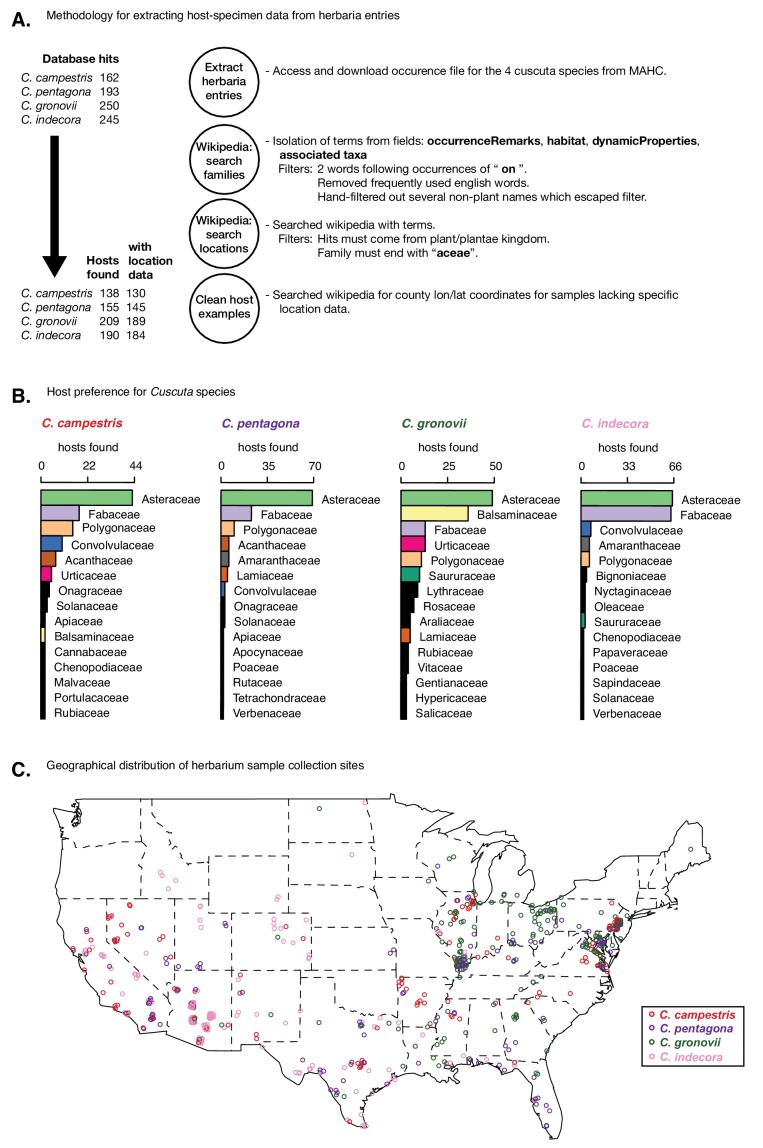
Figure 1—figure supplement 1. Host preference in Cuscuta species in the United States.

Figure 1—figure supplement 1.

(A) Pipeline for processing herbaria data from the mid-atlantic herbaria consortium (MAHC; http://midatlanticherbaria.org) on interactions with each Cuscuta species of interest. (B) Ranked list of most identified host families for each species. Top 15 are shown for each species, with the top 10 overall identified with consistent colors (all others in black). (C) Geographical listings within the United States for each sample, where latitude and longitude or a searchable county are found.

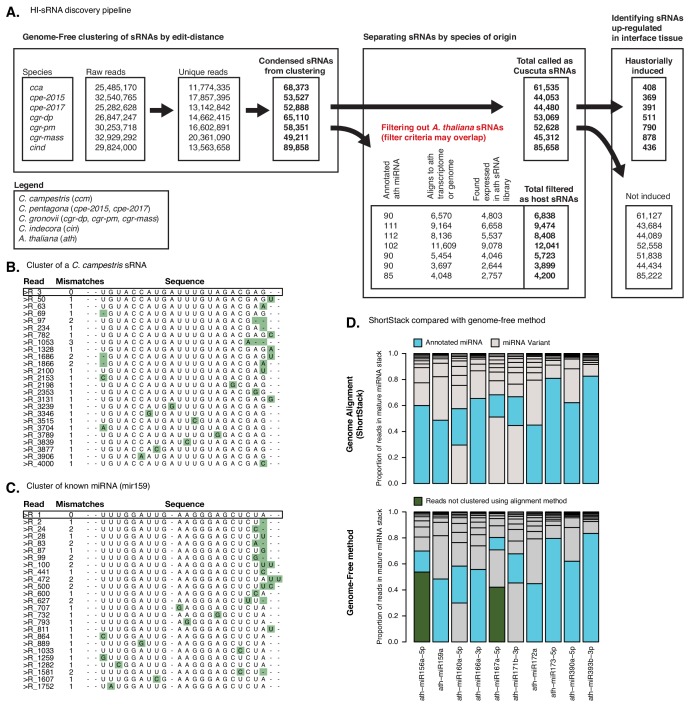
Figure 1—figure supplement 2. Genome-free HI-sRNA discovery pipeline.

Figure 1—figure supplement 2.

(A) Discovery of HI-sRNAs in Cuscuta isolates. Three major steps include condensing reads to representative sRNAs in a genome-free manner, filtering reads which could have originated from A. thaliana, and performing differential expression with DEseq2 to find reads up-regulated in the interface tissue (FDR < 0.1, null hypothesis: sRNA not differentially expressed). (B) Example of a C. campestris sRNA discovered by this method, with the top 25 constituent sRNA sequences ranked by expression. Highest expressed read is deemed as the representative sRNA sequence and is shown with black box. Green boxes show variations from representative sequences with total distance shown to left. (C) Same as B but with a known miRNA, showing similar variation to the novel sRNA in B. (D) Comparing the proportion of reads present in annotated miRNAs, using both genome-alignment (ShortStack) and genome-free based approaches. Reads are ranked by size, with the canonical miRNA (blue) and the variants (grey) showing the proportion of reads they make up in the sRNA. Reads grouped in the locus by the genome-free method that are absent in the alignment approach are shown in green.