. 2019 Dec 17;8:e49750. doi: 10.7554/eLife.49750

Figure 2. Host targets of Cuscuta HI-sRNAs.

(A) Modeled sRNA-target interaction for A. thaliana CRCK2. (B) Secondary siRNA accumulation from CRCK2. (C) Phasing analysis of secondary siRNAs from CRCK2. Expected phase for cut-site shown in red. (D) Size distribution of CRCK2 secondary siRNAs. (E) Frequency of 5’ ends from the CRCK2 mRNA, with the predicted HI-sRNA cut site shown in red. (F) Host mRNAs with confirmed targeting by a Cuscuta HI-sRNA. Full details in Figure 2—figure supplement 1 and Supplementary file 6.

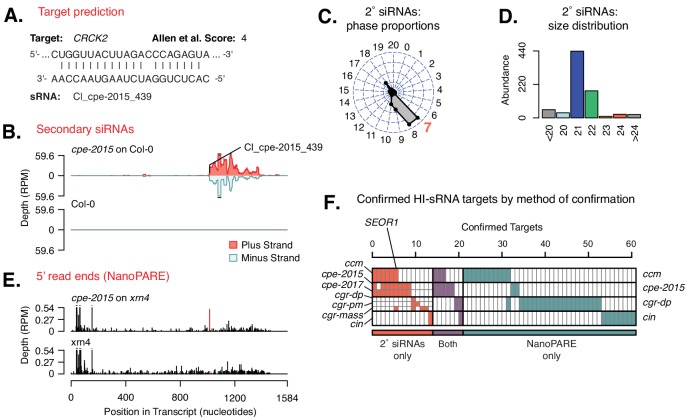
Figure 2.

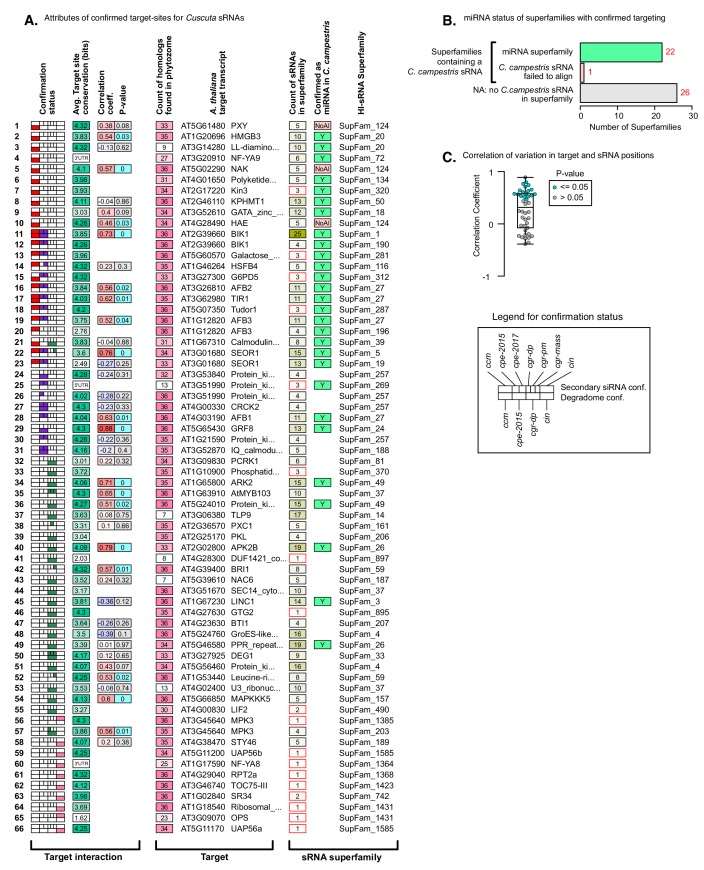
Figure 2—figure supplement 1. Summary of Cuscuta HI-sRNA and host gene target relationships.

Figure 2—figure supplement 1.

(A) Complete list of target interactions between sRNAs and host genes. Confirmation status diagram indicates in what species the interaction is confirmed. Target gene information includes the number of homologs found in 36 eudicot transcriptomes. sRNA counts in superfamilies and the presence of a confirmed miRNA in the family is shown (NoAl: ccm sRNA failed to align to ccm genome). Target interaction columns indicate the conservation at the translated target site in an alignment of found homologs (5’/3’ UTR: not considered for conservation analysis). Correlation coefficient and P-value for variation in positions in target and sRNA superfamily shown. (B) Breakdown of superfamilies with confirmed targeting by the presence of a confirmed miRNA, where possible. (C) Correlation of positional variation in target-sites and their sRNAs, indicating the interactions with a significant correlation.

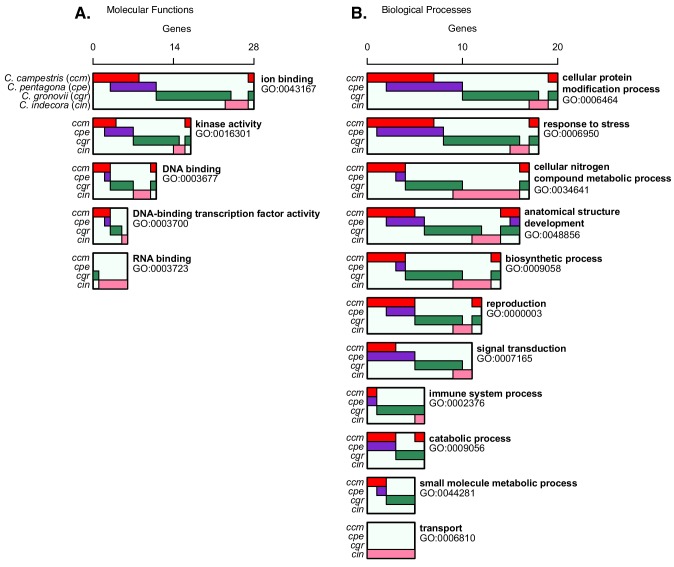
Figure 2—figure supplement 2. Most common GO terms for confirmed target genes.

Figure 2—figure supplement 2.

(A) GO terms for molecular function with a nodescore ≥5.0, demonstrating the species for which the interaction is confirmed with colored bars. Locations where bars overlap indicate genes where both species have confirmed targeting. (B) Same as with A, but for biological processes.