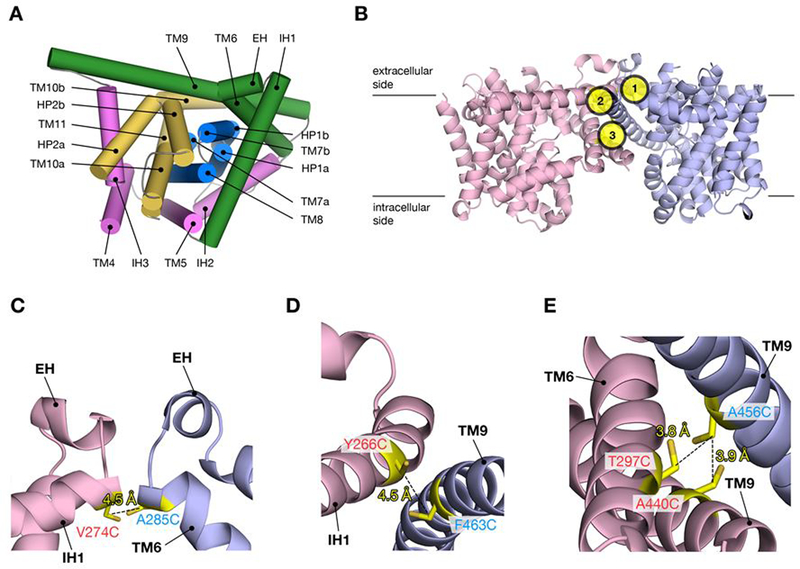
Figure 2.
Comparative structure model of hCNT3 and the location of the mutated sites. A) A cartoon representation of the comparative structure model of hCNT3 based on the structure of vcCNT (PDB ID 3TIJ)(ref. 16). The trimerization domain is shown in green, scaffold domain in pink, and the inverted repeats performing the transport catalysis function in blue and yellow. B) Cartoon representation of the putative hCNT3 homo-trimer shown in the plane of the membrane. Two separate protomers are shown in blue and pink. Three mutagenesis sites are numbered and shown in yellow. C) Cartoon representation of the first mutagenesis site, where the side chains of V274C and A285C are shown as sticks. D) Cartoon representation of the second mutagenesis site, where the side chains of Y266C and F463C are shown as sticks. E) Cartoon representation of the third mutagenesis site, where the side chains of two separate pairs of mutants, T297C/A456C and A440C/A456C are shown as sticks.

