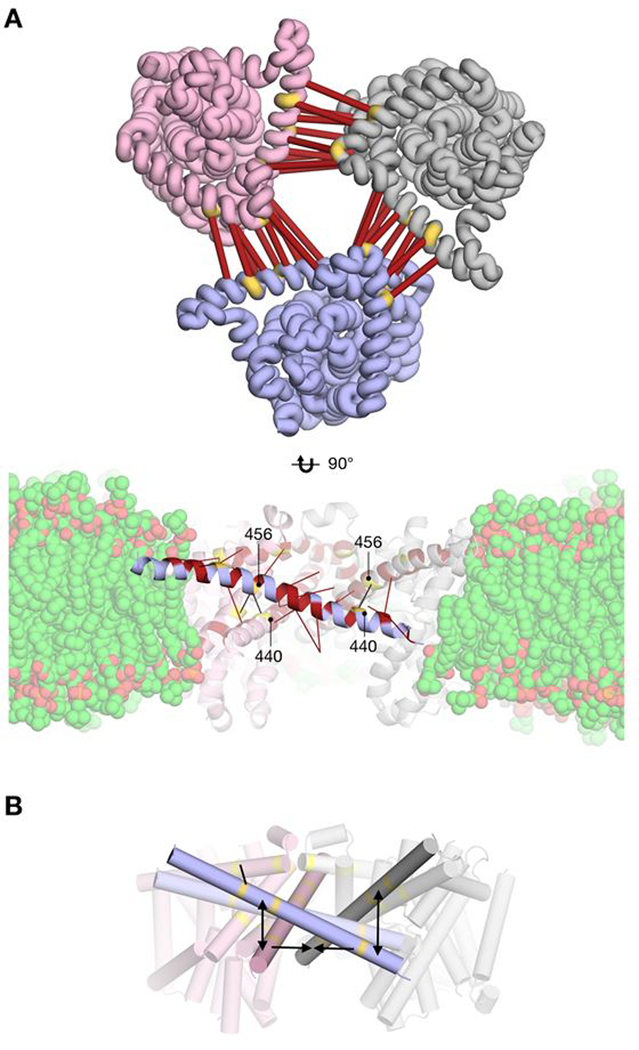
Figure 4.
Residue covariation between different protomers and a schematic of the proposed differences between hCNT3 and vcCNT. A top) Cartoon representation of the hCNT3 comparative structure models is shown from the extracellular side. Three protomers are shown in different colors. Residue pairs with a high GREMLIN covariation score across the dimerization interface are shown in thick red bars. Location of mutated cysteines is shown in yellow. A bottom) Cartoon representation of the hCNT3 comparative structure model is shown with a simulated membrane aligned from the MemProtMD entry 3TIJ (ref. 44). Residue pairs involving TM9 residues with a high GREMLIN covariation score are shown in red. Red bars indicate the location of the other intra-or inter-protomer residue in a covariation pair. Location of mutated cysteines is shown in yellow. Black lines are drawn between pairs of mutated cysteines. B) Cartoon representation of the comparative structure model of hCNT3 homo-trimer shown in the plane of the membrane, where TM9 on each of the protomers is highlighted. We propose a model where TM9 in the human structure is rotated in the plane of the membrane compared to the equivalent TM6 in vcCNT.

