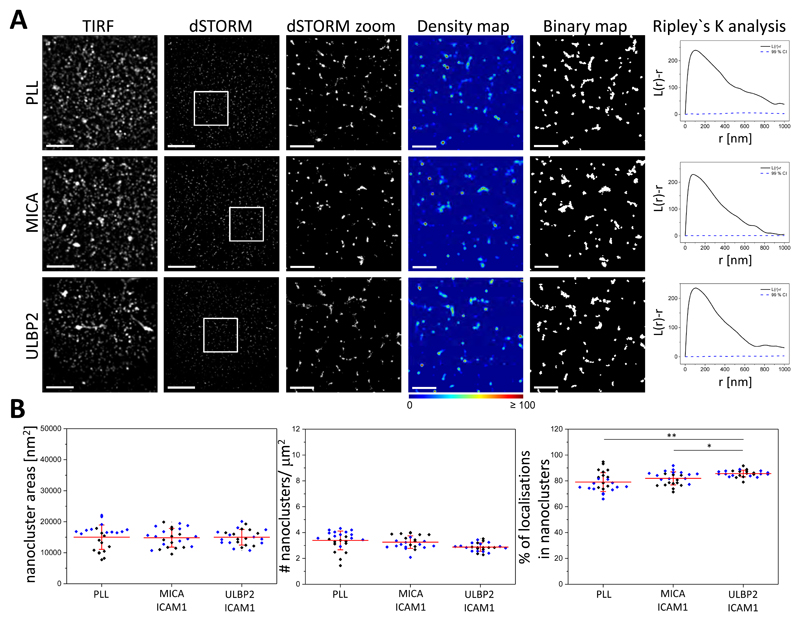
Fig. 2. Blockade of NKG2D ligands prevents the reorganization of NKG2D nanoclusters.
(A) Representative TIRF and dSTORM images of NKG2D on pNK cells incubated for 10 min on slides coated with PLL, MICA and ICAM-1, or ULBP2 and ICAM-1, blocked with specific antibodies against MICA or ULBP2 as appropriate, and then stained with fluorescently labelled specific mAb against NKG2D. Scale bars, 4 μm. Regions outlined in white are magnified and shown with corresponding density images according to the pseudocolor scale bar, thresholded binary maps, and Ripley’s K analysis. Scale bars, 1 μm. (B) Nanocluster areas (left), nanocluster density (middle), and percentage of localizations in nanoclusters (right) for NKG2D from the data shown in (A). Each symbol represents the median of several 5 μm x 5 μm regions from one cell. Lines represent means ± SD. Data are from a minimum of 12 cells from two independent donors. Each color represents one donor. *P < 0.05 and **P < 0.01 by one-way ANOVA with Tukey’s post-hoc test. Nonsignificant differences are not indicated.

