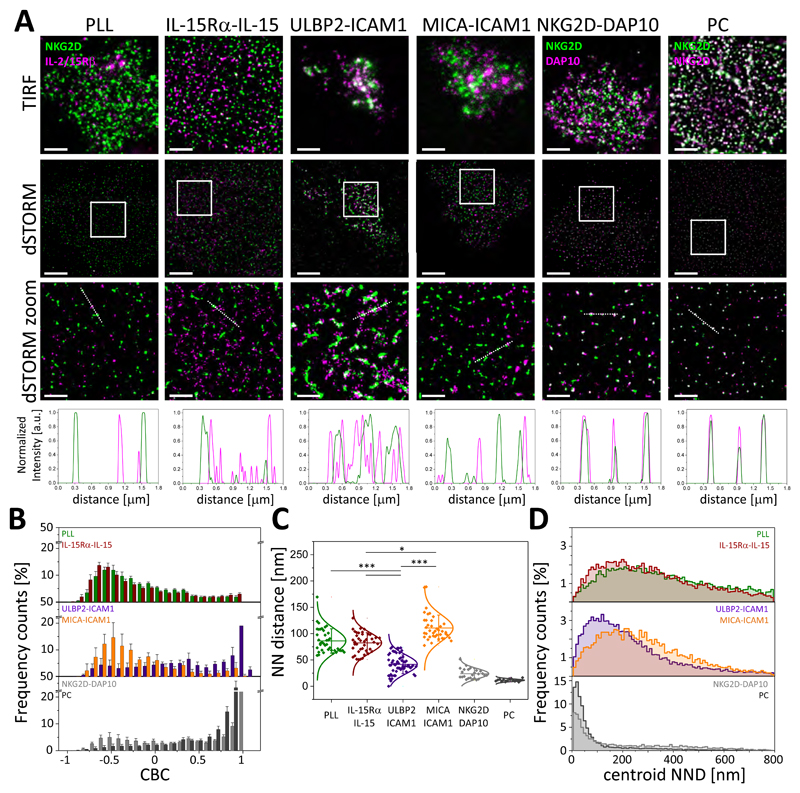
Fig. 6. ULBP2 induces the association between NKG2D and IL-2/IL-15Rβ nanoclusters.
(A) TIRF and dSTORM images showing NKG2D and IL-2/IL-15Rβ on pNK cells incubated for 10 min on slides coated with PLL, MICA and ICAM-1, ULBP2 and ICAM-1, or IL-15Rα–IL-15 and stained with anti-NKG2D-Atto488 and anti-IL-2/IL-15Rβ-AF647 mAbs. Regions outlined in white are magnified with relative fluorescence intensity profiles along the white lines. Scale bars, 4μm, 1μm (zoom). As a positive control, cells on PLL-coated slides were stained with anti-NKG2D-Atto488 and anti-DAP10-AF647 mAbs or were stained with anti-NKG2D-Atto488 mAb followed by anti-mouse-IgG1-AF647 secondary antibody (PC). Colocalization between channels is shown in white. (B) CBC histograms of the single-molecule distributions of the colocalization parameter for NKG2D and IL-2/IL-15Rβ in cells incubated as in (A). Data are from a minimum of 10 cells from two independent donors. Bars represent means ± SD. (C) NND analysis of the data shown in (A). Data are from a minimum of 30 cells from two independent donors; two donors for the positive controls. Symbol represents the median NND of all paired single-molecule localizations from one cell. Lines/errors represent means ± SD. *P < 0.05 and ***P < 0.001 by Kruskal-Wallis (Dunn’s post-test). (D) Histogram distributions of the NND between the centroids of nanoclusters from one channel and the centroid of their nearest neighbor from the second channel from cells incubated as described in (A). Nonsignificant differences are not indicated.

