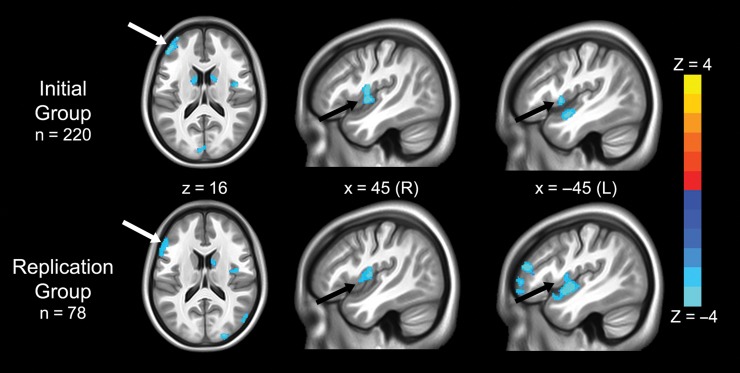
Figure 1.
Regions where gray matter volume was related to rs3918242 variation in independent groups. Blue colors indicate voxels where T-allele carriers had increased gray matter volume compared with CC homozygotes in the initial group of 220 participants (top row) and the replication group of 78 participants (bottom row). There were no regions in which gray matter volume was greater in C homozygotes. Note the high degree of spatial overlap across groups, specifically in the left dorsolateral prefrontal cortex (white arrows) and bilateral insula (black arrows). Statistical maps are thresholded at P < 0.005, uncorrected, and show clusters larger than 1000 mm3.

