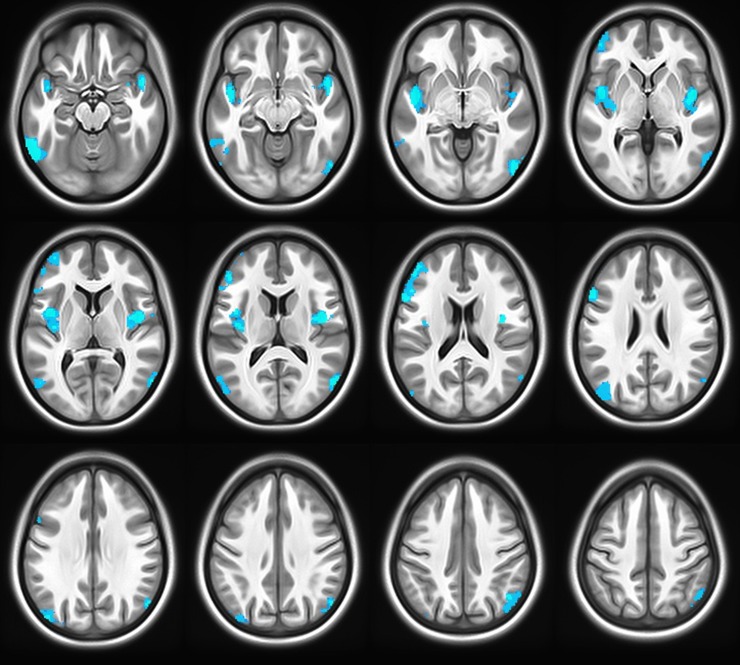
Figure 2.
Associations between gray matter volume and rs3918242 after combining the initial and replication groups using Stouffer’s Z-score method. Significant clusters at P < 0.05, corrected for family-wise error. Blue indicates voxels in which T-allele carriers had increased gray matter volume compared with CC homozygotes. As expected, regions identified in both independent groups, left DLPFC and bilateral insulae (Fig. 1) were also highlighted here, as were several regions found only in the combined analysis. These included the inferior parietal lobules and fusiform gyrus.

