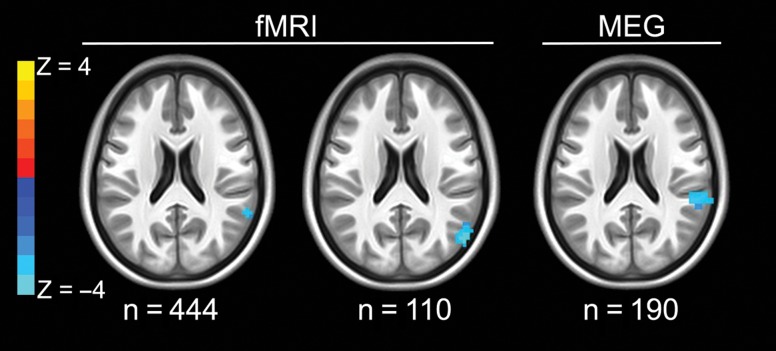
Figure 3.
Working memory-related neurofunctional changes in the right inferior parietal lobule according to rs3918242 genotype during fMRI and MEG. Axial slices shown are at z = 21. Blue colors represent greater working memory-related activation in T-allele carriers compared with CC homozygotes, for fMRI (left: initial discovery group, n = 444; middle: replication group, n = 110) and increased beta desynchronization in T-allele carriers for the MEG data (rightmost slice: n = 190). Statistical maps are thresholded at P < 0.005 uncorrected and clusters larger than 1000 mm3.

