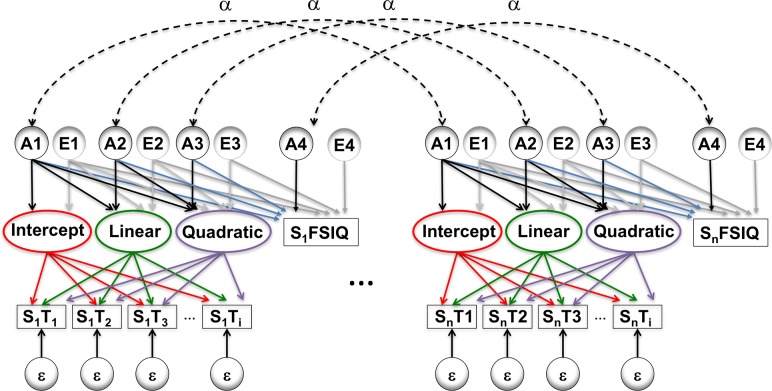
Figure 2.
Simplified path diagram. Rectangles denote observed measures of full scale IQ and cortical thickness (measured at up to 8 timepoints), with circles indicating latent variables. Changes with time are modeled with a latent growth curves, allowing for both linear and nonlinear effects with age. Variance and CT–IQ covariance were decomposed into genetic (A), environmental (E), and error (ε) components. Paths in red were constrained to unity, green paths were defined as age at timepoint i, purple paths were set to age2 at timepoint i, and α represents the degree of kinship between 2 family members. The remaining paths were freely estimated. The paths in blue contribute to genetically mediated CT–IQ covariance. While only 2 related individuals are shown, the model included up to 5 members per family.

