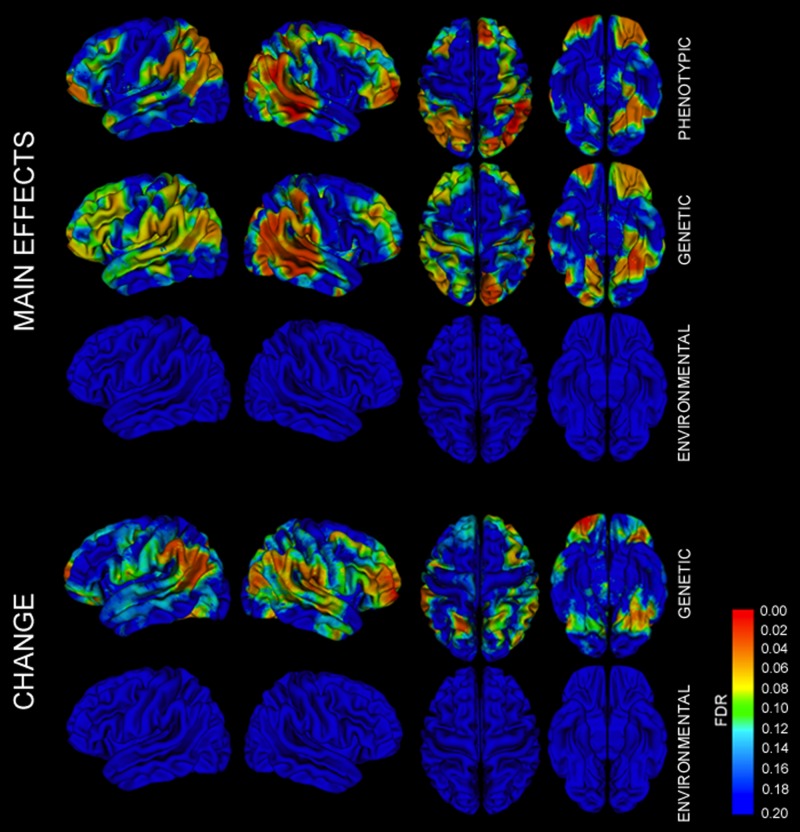
Figure 3.
FDR-corrected probability maps of CT–IQ covariance. Main effects of phenotypic, genetic, and environmental factors on CT–IQ covariance, as well as effects of genetic and environmental factors on changes in covariance over time. Similar maps with discrete significance thresholds are also provided in Figure S1.

