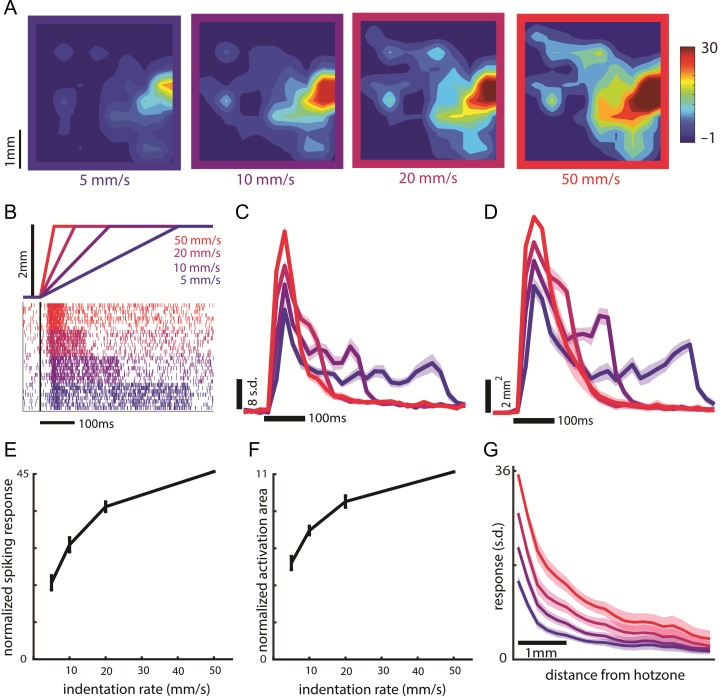
Figure 4.
Effect of indentation rate on the transient response. (A) Heat map of neural activity during the first 40 ms of the response (starting 20 ms after stimulus onset to account for response latency) to a 2-mm indentation delivered to the second palmar pad of monkey C at indentation rates of 5, 10, 20, and 50 mm/s (40 ms is the probe movement time at the highest indentation rate; data averaged across 54 trials per indentation rate). (B) Indentation traces (top), along with the (color-matched) cortical responses (bottom). Indentation depth is constant so ramp durations increase as indentation rate decreases, as do the corresponding transient responses. (C) Time course of the response at the hotzone electrode to a 2-mm indentation at each indentation rate, averaged over 1535 trials across 8 skin locations from 2 arrays (second array of Monkey B and monkey C, same data for C–G). In panels C–G, responses were normalized as in Figure 3 (N = 8 skin locations). Leftmost edge of the time scale bar indicates stimulus onset. (D) Dynamics of the spatial extent of activation evoked by a 2-mm indentation at each indentation rate. Peak activated area was normalized as in Figure 3. Leftmost edge of the scale bar indicates stimulus onset. Shaded area shows the SEM (N = 8). Responses in C and D were calculated in 20-ms bins. (E) Mean and SEM of the cortical response at the hotzone electrode versus indentation rate during the transient for a 2-mm indentation. We used the same integration time window for each indentation rate (first 40 ms of the response starting 20 ms after stimulus onset). (F) Mean and SEM of the activated area versus probe indentation rate during the transient for a 2-mm indentation. We used the same integration time window at each indentation rate. (G) Response as a function of distance from the hotzone at the different indentation rates.

