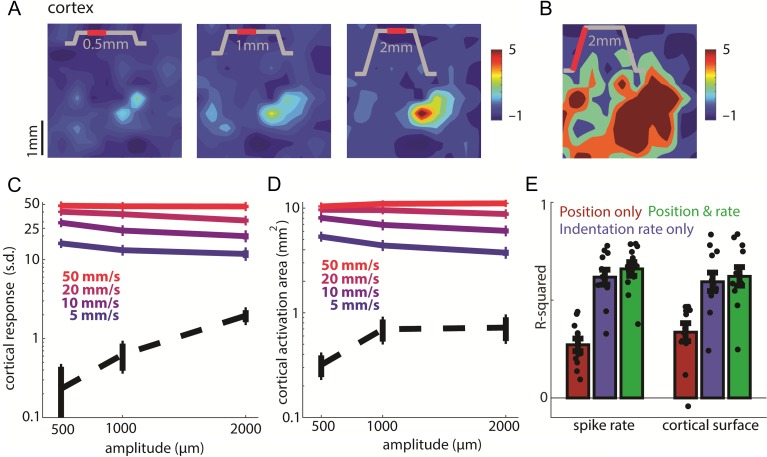
Figure 5.
Effect of indentation depth on the sustained and transient responses. (A) Top: Spatial layout of the sustained response to 0.5-, 1-, and 2-mm indentations delivered to the little fingertip of monkey A at 10 mm/s (min 40 trials per amplitude). The inset shows the stimulus trace, the red section the relevant stimulus epoch (200 ms beginning 200 ms after the probe stopped moving, the only exception being the 2-mm, 5 mm/s indentation, for which the sustained epoch represents only the last 150 ms before probe retraction begins). (B) For comparison, spatial layout of the cortical response during contact onset of the same stimulation (the first 200 ms of the response). (C) Standardized firing rate at the hotzone electrode versus indentation depth during the transient phase (solid lines) and the sustained phase (dashed line) of the stimulus (4603 trials averaged across 8 skin locations from monkey B’s second array and monkey C, same for C–E). The solid lines correspond to indentation velocities of 5, 10, 20, and 50 mm/s, and the dashed line to the sustained response averaged across trials at all velocities. Error bars show the SEM (N = 8). Responses were integrated over the full duration of the stimulus ramp. Note the logarithmically scaled ordinate. (D) Activation area versus indentation depth for the same stimuli and epochs as in C. (E) Fit of linear models relating spike rate at the hotzone electrode (left 3 bars) and activated cortical surface (right 3 bars) to time-varying indentation depth and rate. Neuronal responses primarily track indentation rate. Dots show the individual stimuli, and error bars show the SEM (n = 12 stimuli). Each color denotes different inputs used for both model training and reconstruction of the response.

