Figure 6.
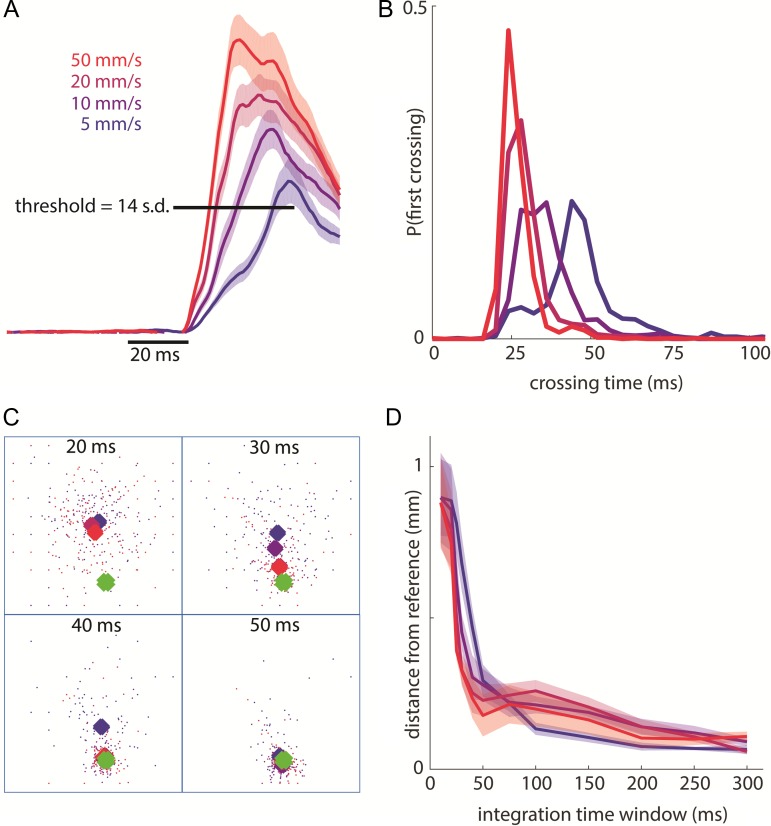
Rapid detection and localization of contact events. (A) Pooled response of the 20 most responsive electrodes (for each skin location) around stimulus onset (smoothed over a 10-ms causal window). Shaded area shows the SEM (4603 total trials across 8 stimulation sites from monkey B’s second array and monkey C). Leftmost edge of the time bar indicates stimulus onset. The threshold bar indicates the minimum single-trial response to signal a contact event (used to obtain the distribution in panel B). (B) Distribution of threshold-crossing times for each indentation rate for the same trials as in panel A (grouped in 4-ms bins). (C) For one example skin location (first palmar pad of monkey C), scatter plot of centroids for single-trial responses (small dots, color-coded by indentation rate) and mean responses (large diamonds) at integration windows of 20, 30, 40, and 50 ms following stimulus onset. The square denotes the 4 mm × 4 mm array and the green diamonds shows the reference centroid (calculated using an integration time window of 300 ms across all trials). The average centroids migrate to the reference centroid location within 40–50 ms. (D) Mean distance (across same stimulation sites as in A) between the reference centroid and the average centroids (for each indentation rate) as a function of integration time. Shaded area shows SEM.

