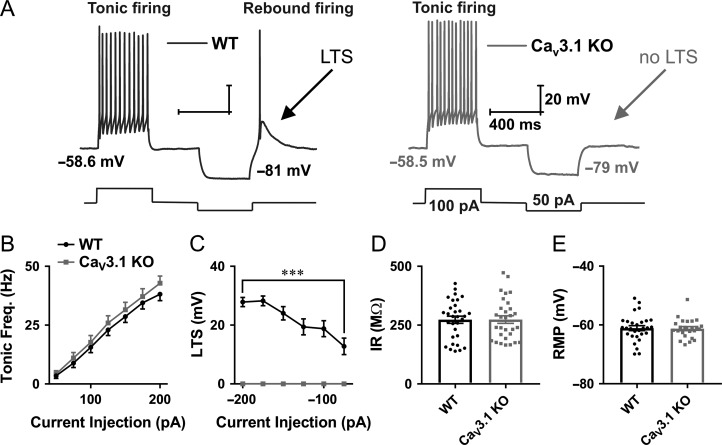
Figure 2.
Different patterns of excitability of CeM neurons in WT and CaV3.1 KO mice. A, Original traces from representative neurons in the CeM recorded from WT (left panel, black trace) and CaV3.1 KO mice (right panel, gray trace) show active membrane responses to a depolarizing (100 pA) and hyperpolarizing (−50 pA) current injection. Note that CeM neuron from CaV3.1 KO mice does not show APs with low threshold spike (LTS) after membrane hyperpolarization. B, Graph of averages of tonic AP firing frequency and current injections of 50–200 pA from multiple experiments shows no difference between WT and mutant mice (WT – 31 cell, 10 animals, CaV3.1 KO – 30 cells, 9 animals; two-way RM ANOVA: interaction F(6354) = 0.45, P = 0.85; current injection F(6354) = 244.00, P < 0.001; WT vs. mutant F(1,59) = 0.63, P = 0.43). C, Graph of averages of LTS amplitudes from multiple experiments following escalating current injections ranging from −50 to −200 pA (WT – 31 cell, CaV3.1 KO.− 28 cells). Recordings from CaV3.1 KO mice (gray line) show no LTS as a response to hyperpolarizing current injections (two-way RM ANOVA: interaction F(5285) = 16.51, P < 0.001, current injection F(5258) = 16.51, P < 0.001 and WT vs. mutant F(1,57) = 110.9, P < 0.001, Sidak’s post hoc presented in figure). D, IR recorded with 75 pA hyperpolarizing current injection, WT – 31 cells, CaV3.1 KO – 30 cells; unpaired two-tailed t-test: t(59) = 0.04, P = 0.97. E, average RMP, WT – 29 cells, CaV3.1 KO – 14 cells; unpaired two-tailed t-test: t(51) = 0.15, P = 0.88. ***P < 0.001.

