Figure 3.
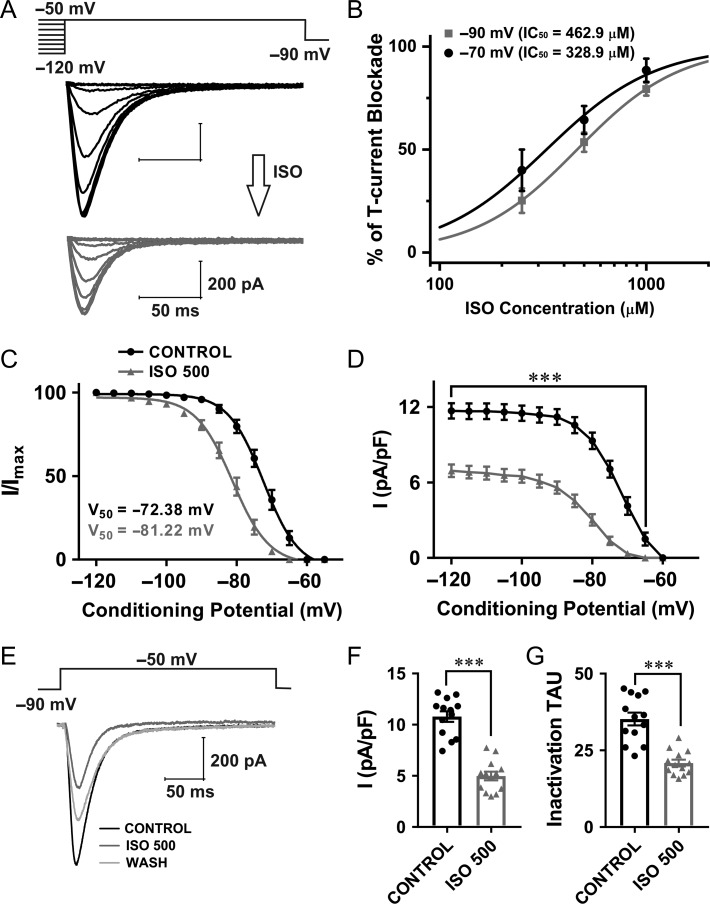
Voltage-dependent inhibition of T-currents in CeM WT neurons by clinically relevant concentration of ISO. A, T-current traces from a representative CeM neuron generated using a double-pulse protocol with 3.6-s-long prepulses for variable voltages (from −120 to −50 mV in 5 mV increments) and a test potential (Vt) of −50 mV; black traces recorded before and gray trace after ISO perfusion. B, The concentration–response curves for ISO inhibition of T-currents in WT CeM neurons under two recording voltages (−70 mV and −90 mV) with respective IC50 values. C, Normalized average steady-state inactivation (I/Imax) curve, depolarizing shift of 8.8 mV in a cohort of neurons after ISO perfusion was statistically significant from a control cohort (paired two-tailed t-test: t(24) = 12.96, P < 0.001). The average V50 values for steady-state inactivation for baseline was −72.4 ± 0.5 mV (black curve; 13 cells, 6 animals) and for ISO −81.2 ± 0.4 mV (gray curve). Slope factors for control and ISO were similar (5.0 ± 0.4 and 5.2 ± 0.4, respectively). D, Average current density, as calculated from the steady-state inactivation protocol. Perfusion with ISO significantly decreased current density by approximately 2-fold (two-way RM ANOVA: interaction F(12,144) = 26.95, P < 0.001; voltage F(12,144) = 165.00, P < 0.001; ISO F(1,12) = 122.90, P = 0.43, Sidak’s multiple comparison presented in figure). E, Averaged representative traces recorded under control conditions (black), after application of ISO (gray) and after wash (light gray trace) using a protocol depicted on the top of traces (Vt = −50 mV, Vh = −90 mV). F, Averaged current density show reduction in current density by 54% after application of ISO (13 cells, 6 animals; paired two-tailed t-test: t(12) = 9.38, P < 0.001). G, ISO decreased averaged inactivation tau from 35.20 ms (control conditions) to 20.85 ms (13 cells, 6 animals; paired two-tailed t-test: t(12) = 7.58, P < 0.001). ***P < 0.001.

