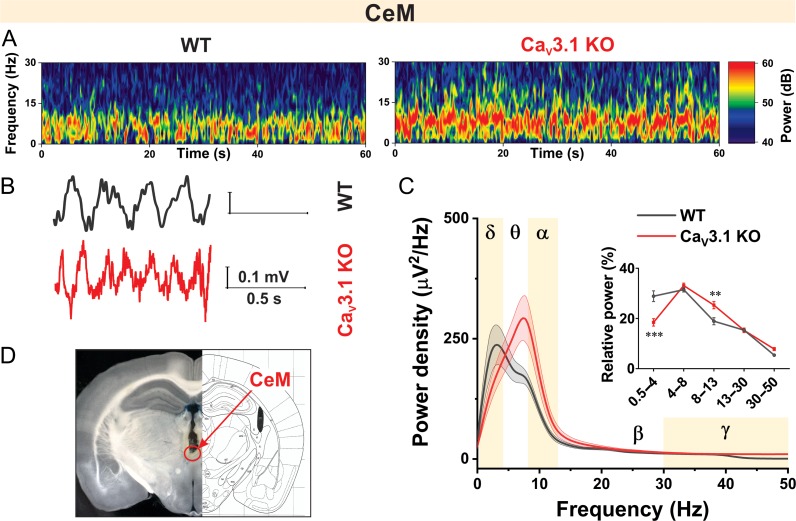
Figure 7.
Oscillatory differences between WT and CaV3.1 KO mice in CeM during quiet awake state. A, Representative thalamic (CeM) spectrograms during quiet awake state from WT (left) and CaV3.1 KO (right) mice. B, Representative raw CeM traces from WT (gray) and CaV3.1 KO (red trace) mice. C, Power density and relative power (inset in figure) revealed decreased percentage of δ waves in CaV3.1 KO mice (two way RM ANOVA: interaction F(4,60) = 10.81, P < 0.001, oscillations F(4,60) = 101.10, P < 0.001, WT vs. mutant F(1,15) = 0.58 P = 0.458, Sidak’s post hoc presented in figure). D, Electrode placement conformation. WT – 7 animals, CaV3.1 KO – 10 animals; **P < 0.01, ***P < 0.001.

