Figure 9.
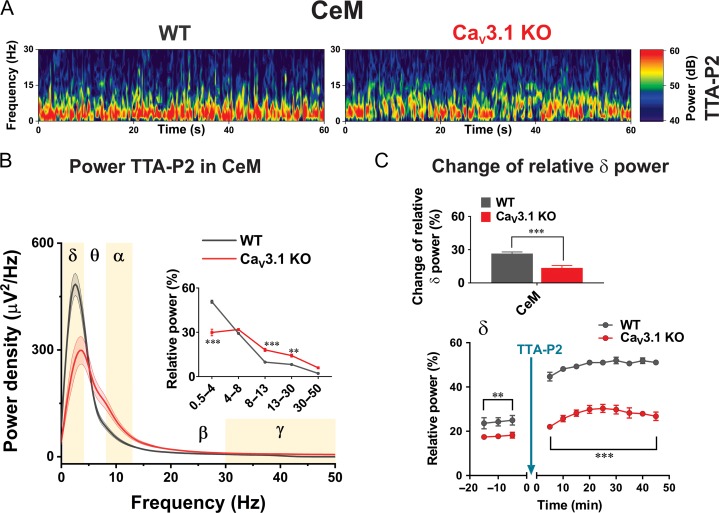
Oscillatory differences between WT and CaV3.1 KO mice in CeM during TTA-P2 administration in vivo. A, Representative spectrograms from CeM 30 min after i.p. injection of 60 mg/kg TTA-P2 recorded from WT (left) and CaV3.1 KO (right) mice. B, Power density and relative power (inset in figure) revealed decreased percentage of δ and increased percentage in α and β waves in CaV3.1 KO mice after TTA-P2 (two way RM ANOVA: F(4,60) = 43.87, P < 0.001, oscillations F(4,60) = 279.50, P < 0.001, WT vs. mutant F(1,15) = 1.31, P = 0.310, Sidak’s post hoc presented in figure). C, Change of relative δ power in CeM (relative power under TTA-P2 – relative power during baseline) revealed differences between WT and mutant mice (unpaired two-tailed t-test: t(15) = 4.57, P < 0.001). Relative δ power across time during baseline revealed higher δ oscillations in WT animals (two way RM ANOVA: interaction F(2,28) = 0.09, P = 0.914, time F(2,28) = 1.13, P = 0.336, WT vs. mutant F(1,14) = 8.93, P < 0.01). Additionally, there was higher relative δ power after TTA-P2 administration in WT mice during all recorded period (two way RM ANOVA: interaction F(8112) = 0.80, P = 0.604, time F(8112) = 11.82, P < 0.001, WT vs. mutant F(1,14) = 154.90, P < 0.001). WT – 7 animals, CaV3.1 KO – 9–10 animals; *P < 0.05, **P < 0.01, ***P < 0.001.

