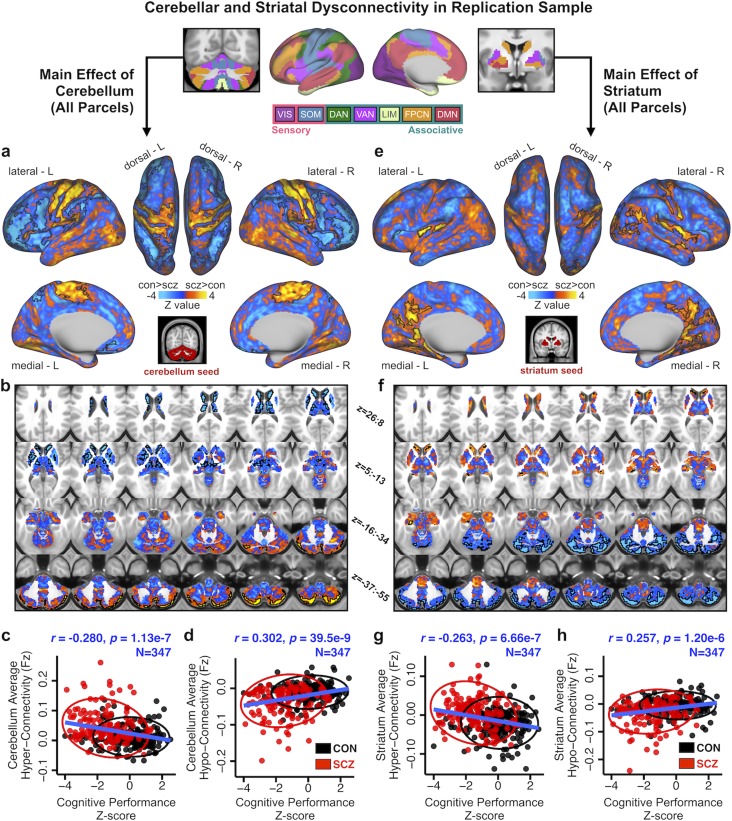
Figure 10.
Main effect of cerebellar and striatal network parcel connectivity in replication sample and relationship with cognition. (a) Cortical surface view of areas showing main effect of Group in whole-brain connectivity with the cerebellar parcels between 167 patients with schizophrenia with psychosis (SCZ) and 162 healthy controls (CON) in an independent dataset. Regions that are significantly different between groups (P < 0.05 with TFCE family-wise error protection) are outlined in black (see also Supplementary Fig. S47). Orange/yellow areas indicate regions where patients exhibited stronger cerebellar connectivity, whereas blue areas indicate regions where patients exhibited reduced cerebellar connectivity, relative to controls. Inset shows coverage of all cerebellar parcels. (b) Subcortical group differences in cerebellar connectivity shown in volume-based axial view, with Z-coordinate ranges (each slice in each row increments by 3 mm). (c) Relationship between mean cerebellar hyper-connectivity and a measure of cognitive performance is highly significant across subjects. (d) Relationship between mean cerebellar hypo-connectivity and cognitive performance is also highly significant across subjects. (e–h) Results for identical independent analysis conducted with the 6 functionally-defined striatal network parcels. Note that there was no representation of the visual network in striatum (Choi et al. 2012) and therefore that network was omitted. Abbreviations: VIS, visual network; SOM, somatosensory; DAN, dorsal attention network; VAN, ventral attention network; LIM, limbic network; FPCN, frontoparietal control network; DMN, default mode network.

