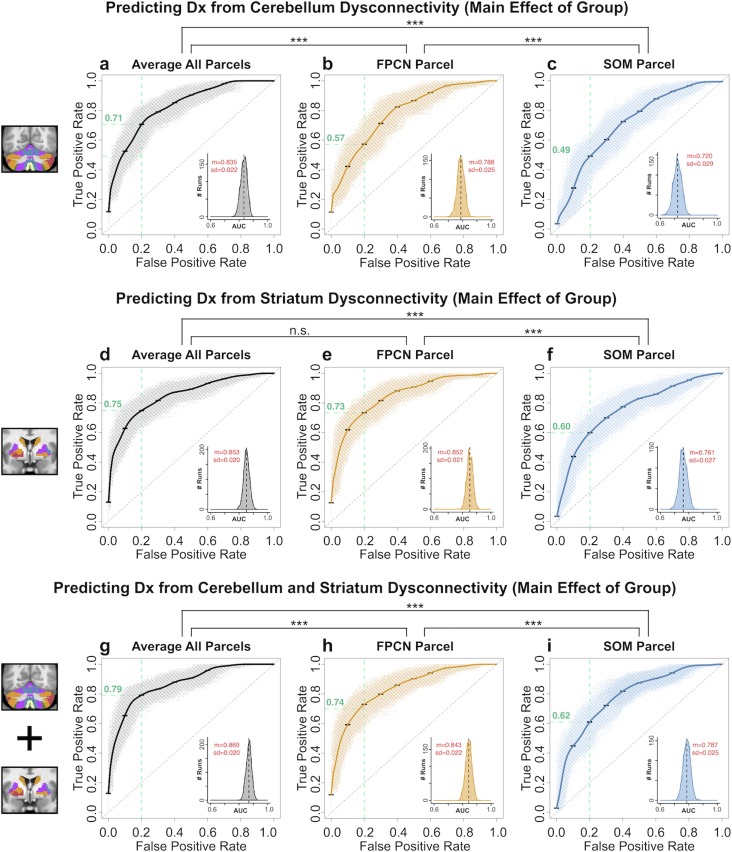
Figure 8.
Receiver operating characteristic (ROC) curves from binary classifiers of diagnostic status trained on cerebellar and striatal dysconnectivity features. Exemplar associative (FPCN) and sensory (SOM) parcels, as well as the average combined across all parcels (AVERAGE), are shown. (a) Performance of classifier using AVERAGE dysconnectivity across all cerebellar parcels. Bold black curve plots the mean true positive rate (TPR) at each false positive rate (FPR) across 1 000 cross-validation runs (standard error bars shown in black). Gray curves show individual results from all cross-validation runs. Inset plots the distribution of the Area Under the Curve (AUC) for all 1 000 runs; black dashed line shows the mean AUC. Mean (m) and standard deviation (sd) of the AUC distribution are displayed in red. (b) Performance of classifier using cerebellar FPCN dysconnectivity. (c) Performance of classifier trained using cerebellar SOM parcel dysconnectivity. Green dashed lines show the TPR for each classifier at FPR = 0.20. The cerebellar FPCN TPR = 0.71, indicating that this classifier achieves a higher sensitivity than the SOM classifier (TPR = 0.49) at the same “cost” of specificity. Similarly, the AUC performance is significantly higher for the FPCN than the SOM classifier (t = 55.692, df = 1953.4, P < 1.0e-15). Asterisks denote significance at P < 0.001 in a two-tailed t-test between the indicated AUC distributions. (d–f) Performance of classifiers using striatal AVERAGE, SOM, and FPCN features. Again, the FPCN classifier outperformed the SOM classifier, as indicated by sensitivity at FPR = 0.20 (FPCN TPR = 0.73, SOM TPR = 0.60) and AUC (t = 83.869, df = 1871.2, P < 1.0e-15). (g–i) Performance of classifiers using combined cerebellar and striatal AVERAGE, FPCN, and SOM features. See Supplementary Figs S34–S36 for ROC curves of all parcels.

