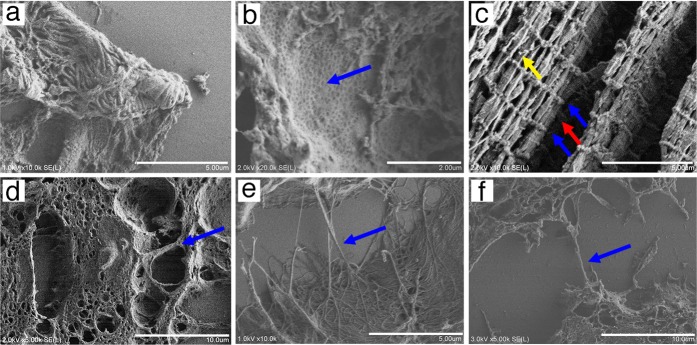
Fig. 3.
Microstructures of paraffin section tissues visualized by the NanoSuit method in field emission-scanning electron microscopy secondary electron images. a Kidney podocyte. b Inner aspect of fenestrated endothelium (blue arrow) of the glomerular capillary. c Skeletal muscle tissue. Striated pattern of myofibrils (Z lines within I-band [blue arrows] and M lines within an A-band [red arrow]) and spherical mitochondria (yellow arrow). d Projection structure in a malignant mesothelioma specimen (blue arrow). e Collagenous fibril in the perivascular area of colon tissue. f Connecting fibers between malignant breast cancer cells (tunneling nanotubes [TnT]-like structures). The scale bars represent 10 (d, f), 5 (a, c, e), and 2 μm (b)

