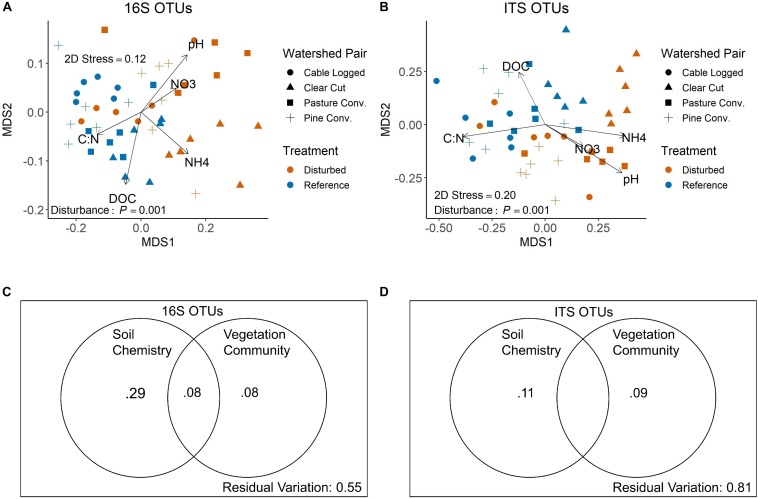
FIGURE 3.
NMDS ordinations of 16S (A) and ITS (B) community structure at the OTU level. P-values shown are overall disturbance effects from PERMANOVA. Vectors display correlations of key soil variables with NMDS axes from envfit. Panels C and D display variation partitioning results for 16S (C) and ITS (D) communities. Values shown are adjusted R2-values for each respective partition, and all partitions shown are statistically significant (distance-based redundancy analysis P < 0.01). Adjusted R2-values < 0 not shown (i.e., middle partition on panel D).

