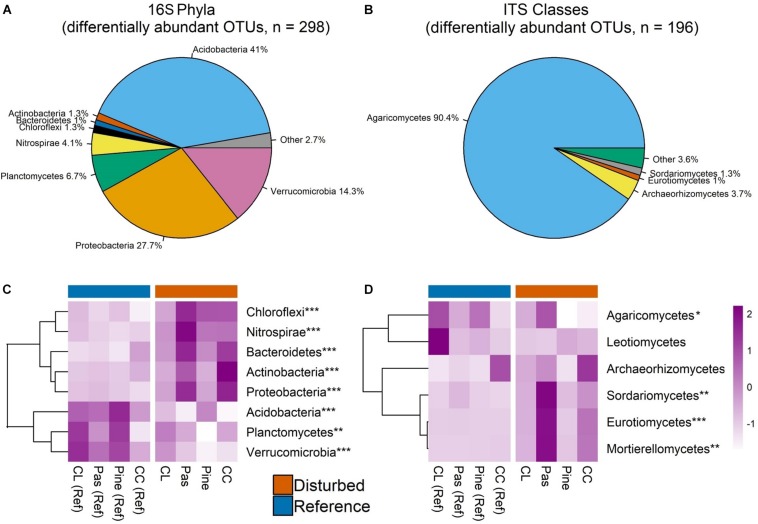
FIGURE 5.
Pie charts display relative abundance of bacterial phyla (A) and fungal classes (B) aggregated across edgeR-identified differentially abundant OTUs. Only phyla/classes comprising >1% of sequences are shown. Heat maps in panels C and D show scaled Z-scores for relative abundances for each bacterial phylum (C) and fungal class (D) for differentially abundant OTUs across each watershed. CC, clear-cut; CL, cable-logged; Pas, pasture conversion; Pine, pine conversion. Asterisks represent statistical significance at the following levels: ∗∗∗P < 0.001, ∗∗P < 0.01, ∗P < 0.05. P-values are main effects of disturbance from two-way ANOVA. Dendrograms on heat maps reflect similarity of relative abundance patterns of taxa across watersheds (complete-linkage clustering) and do not reflect phylogenetic relationships.

