FIGURE 1.
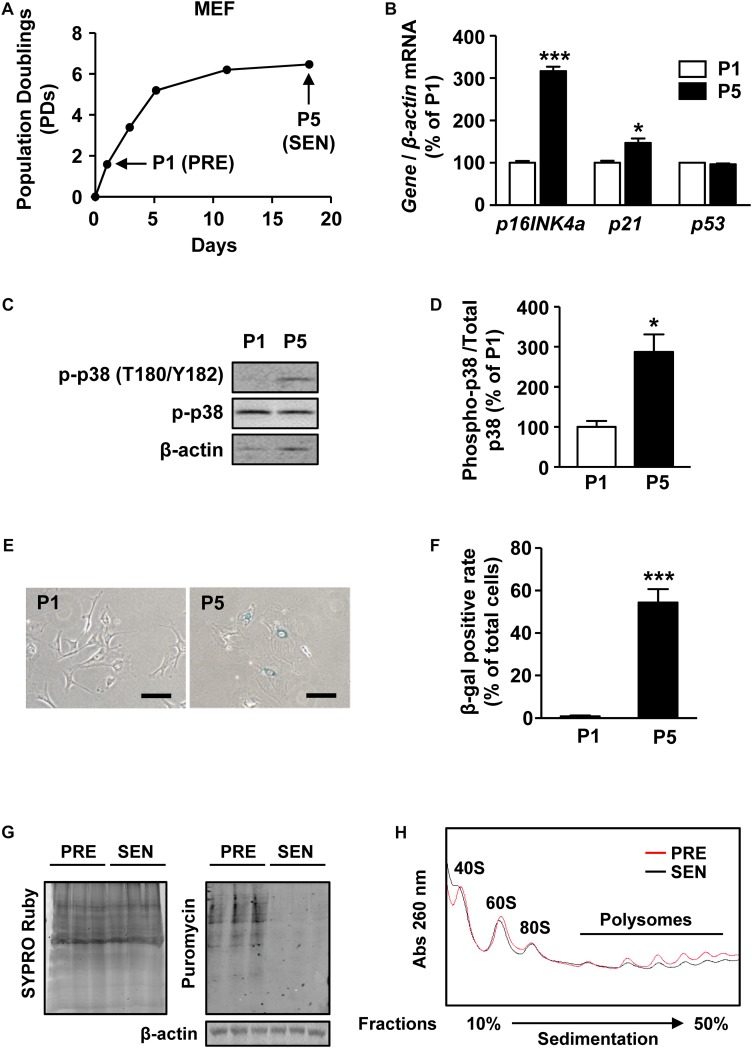
Protein synthesis is globally reduced in senescent MEFs. (A) Growth curve of MEFs from passage 0 to passage 5. PRE and SEN refer to presenescent and senescent, separately. (B) Relative quantification of p16INK4a, p21, and p53 mRNAs in young and senescent MEFs. β-actin was used as internal control (Mean ± SEM, n = 3, ∗∗∗p < 0.001, ∗p < 0.05). (C,D) Representative western blot and quantification of phosphorylated protein and total protein levels of p38 in cell extracts from passage 1 and passage 5 MEFs. Total p38 protein was used as internal loading control (Mean ± SEM, n = 3, ∗p < 0.05). (E,F) SA-β-gal staining and SA-β-gal positive rate of MEFs in passage 1 and passage 5 (Mean ± SEM, n = 3, ∗∗∗p < 0.001). (G) Puromycin incorporation assay of presenescent and senescent MEFs. SYPRO Ruby staining was used to visualize total proteins (left) and immunoactivity of puromycin indicates nascent peptide synthesis rate (right). β-actin was used as internal loading control. (H) Polysomal profiles of young and senescent MEFs with continuous sucrose gradient of 10–50% were fractioned and measured with absorbance of light at 260 nm. Peaks belonged to small subunit of 40S, large subunit of 60S, intact ribosome of 80S and polysomes were labeled.

