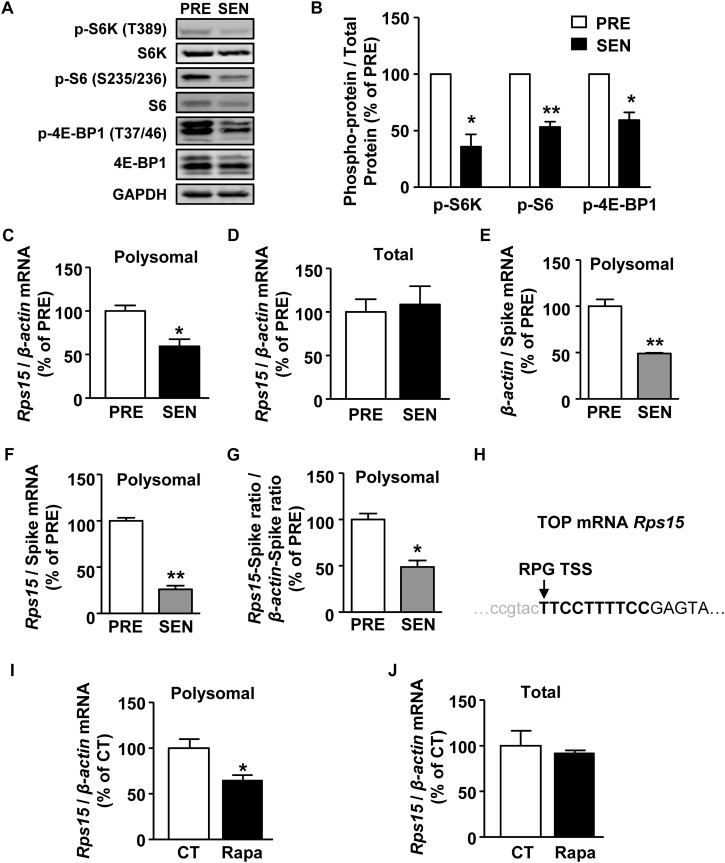
FIGURE 3.
mTORC1 regulates Rps15 mRNA translation during senescence. (A,B) Representative western blot and quantification of phosphorylated protein and total protein levels of S6K, S6, 4E-BP1 in cell extracts from young and senescent MEFs. Relative total proteins were used as internal loading control (Mean ± SEM, n = 3, ∗∗p < 0.01, ∗p < 0.05). (C,D) Relative quantification of Rps15 mRNA using polysomal mRNAs (C) and total mRNAs (D) extracted from young and senescent MEFs. β-actin was used as internal control (Mean ± SEM, n = 3, ∗p < 0.05). (E,F) Relative quantification of β-actin (E) and Rps15 (F) mRNA using polysomal mRNAs extracted from young and senescent MEFs with adding spike RNA of mScarlet after polysome profiling. Spike RNA of mScarlet mRNA was used as internal control (Mean ± SEM, n = 3, ∗∗p < 0.01). (G) Relative quantification of Rps15 mRNA-spike ratio to β-actin-spike RNA ratio from the results of panels (A,B) (Mean ± SEM, n = 3, ∗p < 0.05). (H) Transcription start site (TSS) annotations for TOP-like mRNA Rps15. Arrow head indicates TSS. Bold letters refer to TOP-like structure. Rps15 5’UTR sequence was from Ribosomal Protein Gene Database (RPG). (I,J) Relative quantification of Rps15 mRNA using total mRNAs (I) and polysomal mRNAs (J) extracted from DMSO or rapamycin treated young MEFs (250 nM, 2 h). β-actin was used as internal control (Mean ± SEM, n = 3, ∗p < 0.05).

