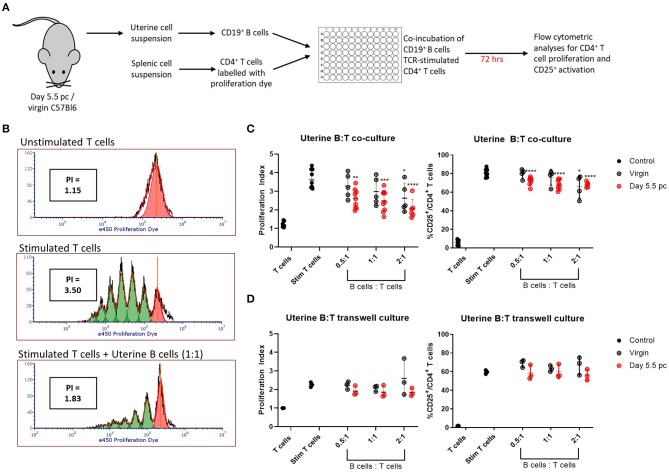
Figure 3.
Uterine B cells from pregnant mice post-implantation suppress CD4+ T cell proliferation and activation. (A) Schematic diagram of the suppression assay used to assess the effect of B cells on CD4+ T cell proliferation and activation. (B) Representative flow cytometric panels illustrating the inhibitory effect of B cells on T cell proliferation quantified via calculation of individual proliferation index (denoted as PI). (C) Graphical summaries of biologically independent experiments assessing amount of CD4+ T cell proliferation and CD25 expression with and without co-culture of increasing ratio of uterine B cells. (D) The same experiments as in (C) except T and B cells were kept physically apart by a 0.4 μm transwell membrane (n = 3–8). Data is presented as mean ± SEM and compared by one-way ANOVA followed by Dunnett's post-hoc test. *p ≤ 0.05, **p ≤ 0.01, ***p ≤ 0.001, ****p ≤ 0.0001. Data were combined from five independent experiments.

